MESSENGER’s instruments are making continuous and high-resolution observations of Mercury that can be obtained only from orbit about the planet. Analyses of data from the spacecraft’s first six months of orbital observations have provided new details about the planet’s volcanic history; have revealed a previously unrecognized terrain type formed by loss of volatile material; have documented Mercury’s surface composition and plasma environment; and are changing previous ideas about how Mercury was formed. The results are reported in a series of seven papers published in a special section of Science magazine on September 30, 2011.
Presenter #1 |
James W. Head, III, Professor of Geological Sciences
Brown University, Providence, RI
Image 1.1
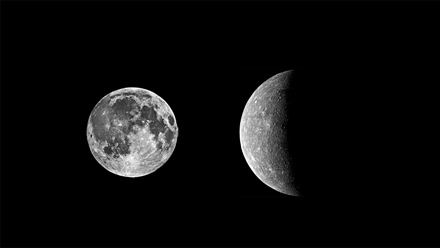
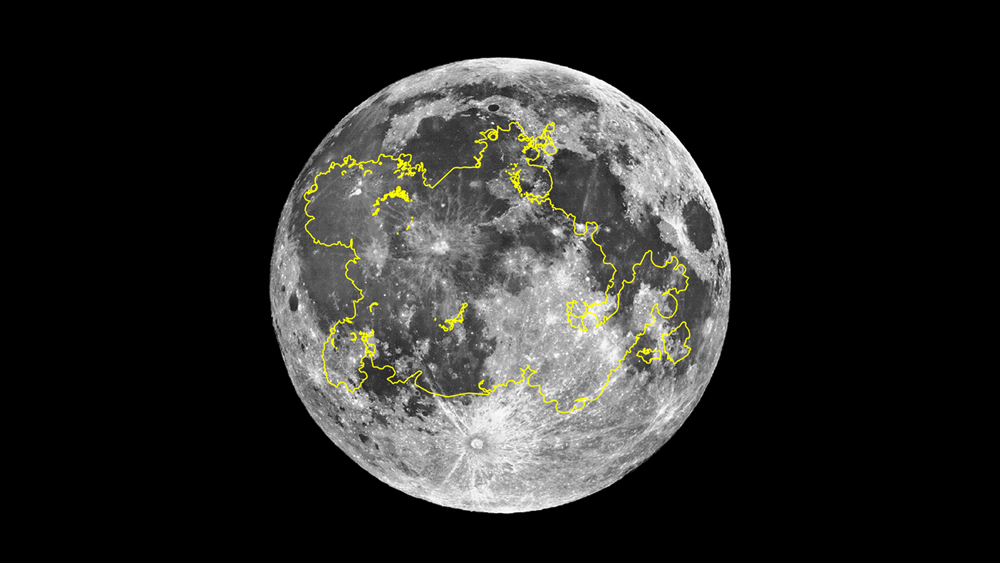
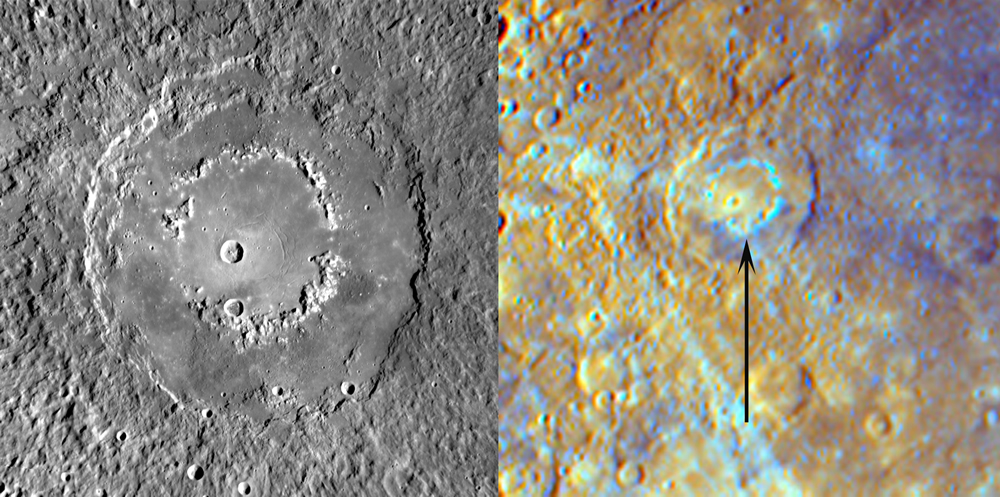
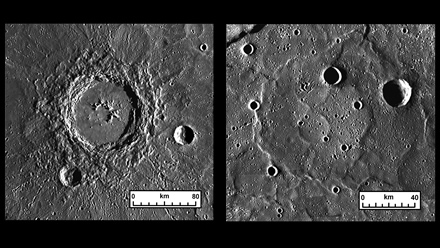
Moon–Mercury image comparison. (Left) The near side of the Moon, showing the dark volcanic areas (maria) composed of lava flows and the bright, heavily cratered highland crust. (Right) Mariner 10 view of Mercury showing that, unlike the Moon, there is no brightness contrast between the cratered terrain and the smooth plains. The Moon is about one-quarter of the diameter of Earth; Mercury is about one-third of the diameter of Earth.
Credit: Lick Observatory (left); NASA/Jet Propulsion Laboratory/U.S. Geological Survey (right)
Click on image to enlarge.
|
|
Image 1.2
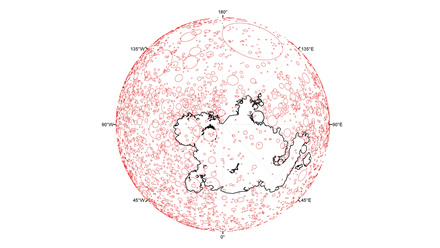
A view looking down on the north pole of Mercury (center). Red circles show the locations of impact craters larger than 20 km in diameter. The area of contiguous northern high-latitude smooth plains mapped by MESSENGER from orbit (inside the black line) covers 4.7 million square kilometers, over 6% of the surface of Mercury. Note that the number of craters superposed on the plains is much less than in the surrounding areas, indicating the relative youth of the plains.
Credit: Courtesy of Science/AAAS and Brown University
Click on image to enlarge.
|
|
Image 1.3
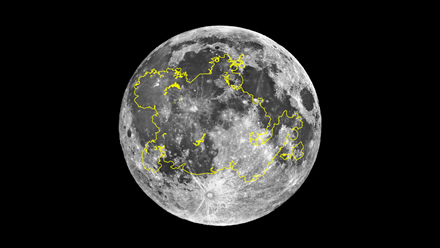
The distribution of Mercury’s northern high-latitude smooth plains superposed on the nearside of the Moon to compare scales. Note the large size compared with individual lunar maria. On the Moon, many of the maria fill round, topographically distinctive impact basins (for example, Imbrium, Serenitatis, Crisium). Similar distinctive basins are not obviously underlying these plains on Mercury.
Credit: Lick Observatory/Brown University
Click on image to enlarge.
|
|
Image 1.4
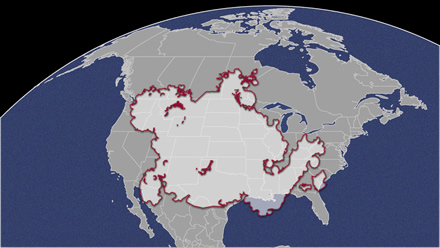
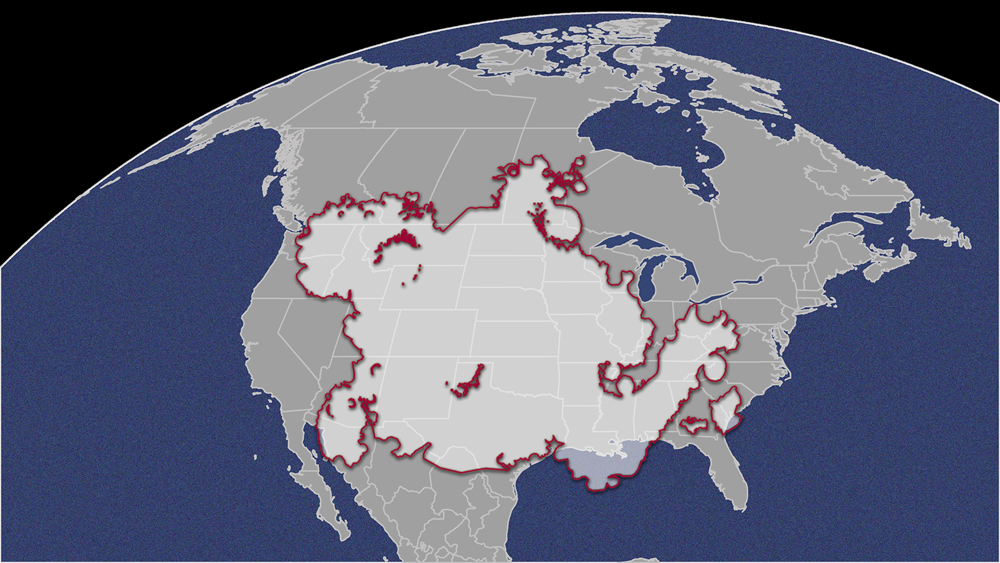
The distribution of Mercury’s northern high-latitude smooth plains superposed on the United States and North America to compare scales. The area of these plains on Mercury equals almost 60% that of the continental United States.
Credit: Brown University/Jennifer Whitten/James Dickson
Click on image to enlarge.
|
|
Image 1.5
Estimating lava flow deposit thicknesses. (Left) A fresh impact crater on Mercury (Hokusai, 114 km diameter, 57.8°N, 343.1°E) provides the opportunity to measure the depth of its interior and the height of its rim above the surrounding terrain. (Right) A "ghost" crater (90 km diameter, 74.3°N, 335.7°E), a circular feature in the volcanic plains outlined by ridges, suggests that the outpouring of the volcanic plains has buried a preexisting impact crater. From an estimate of the height of the rim of the buried crater, the thickness of the lava covering the crater may be determined. Both images were obtained with the Mercury Dual Imaging System (MDIS) during the orbital phase of the MESSENGER mission.
Credit: NASA/Johns Hopkins University Applied Physics Laboratory/Carnegie Institution of Washington
Click on image to enlarge.
|
|
Image 1.6
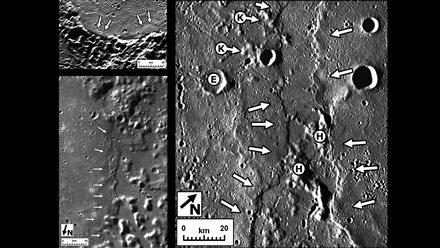
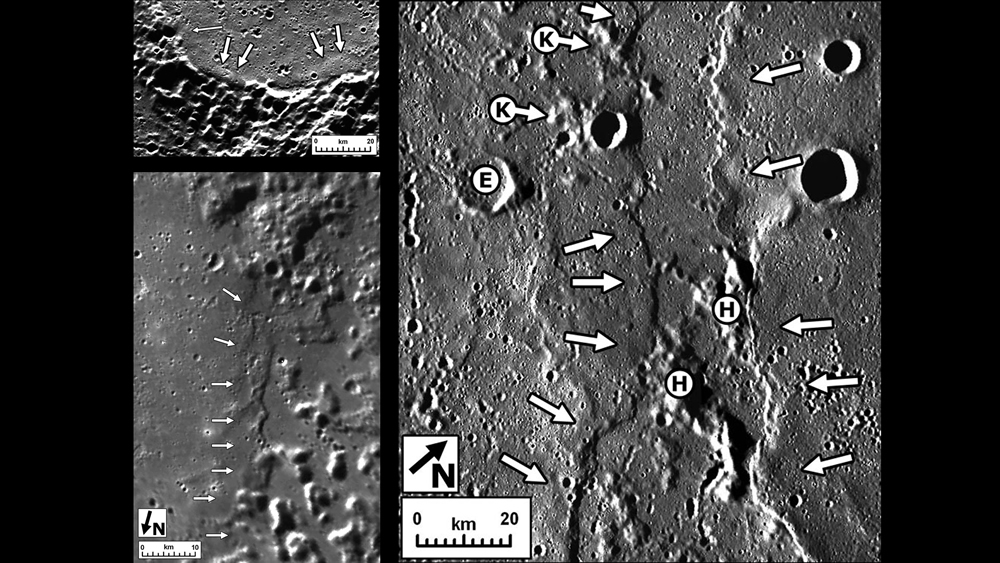
Features interpreted to be lava flow fronts associated with the northern smooth plains deposits on Mercury. (Upper left) Steep flow margin within a flooded impact crater (thick arrows); narrow arrow points to possible flooding of a smaller crater. (Lower left) Smooth plains (left) embaying rough plains (right), with flow front indicated by arrows. (Right) Candidate lava flow fronts (arrows) facing each other. The western flow unit is embaying a crater (E) and flooding the hills (H) between flow fronts to form kipukas (K), islands of pre-existing terrain flooded by lava.
Credit: Courtesy of Science/AAAS
Click on image to enlarge.
|
|
Image 1.7
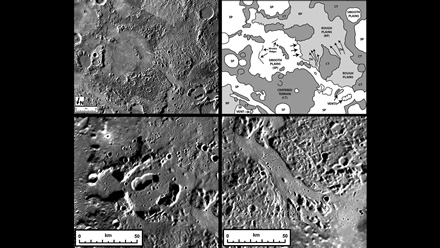
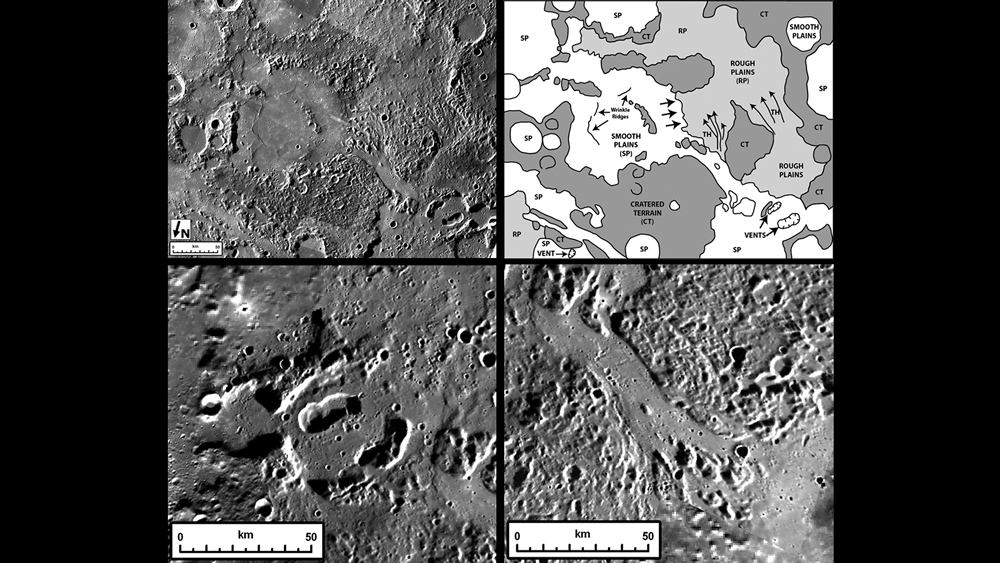
Candidate volcanic vents, lava flow-related channels, and teardrop-shaped features. (Upper left and right) Image and sketch map of the assemblage of volcanic flow-related features. Blunt arrows, flow-front-like embayment (see Image 1.6, lower left); long arrows, teardrop-shaped hills (TH). (Lower left) Pits interpreted as source vents. (Lower right) Teardrop-shaped hills and channel interpreted to be formed by lava erosion.
Credit: Courtesy of Science/AAAS
Click on image to enlarge.
|
|
Presenter #2 |
David T. Blewett, MESSENGER Participating Scientist and Staff Scientist
Planetary Exploration Group, Space Department, Johns Hopkins University Applied Physics Laboratory, Laurel, MD
Image 2.1
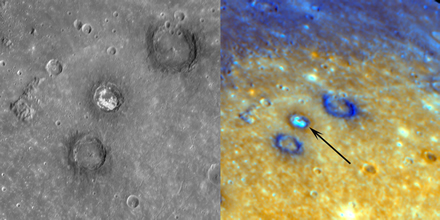
Images of Sander, a 47-km-diameter crater, obtained by MESSENGER during its first flyby. Deposits of unusually bright material can be seen on the crater floor. The enhanced-color locator image emphasizes the high reflectance and relatively blue color of Sander's crater floor deposits.
Credit: NASA/Johns Hopkins University Applied Physics Laboratory/Carnegie Institution of Washington
Click on image to enlarge.
|
|
Image 2.2
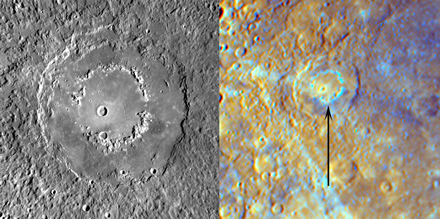
The Raditladi impact basin (258 km in diameter), imaged by MESSENGER as it flew past Mercury for the first time. The ring of central-peak mountains has unusually high reflectance and relatively blue color, as seen in the enhanced-color locator image.
Credit: NASA/Johns Hopkins University Applied Physics Laboratory/Carnegie Institution of Washington
Click on image to enlarge.
|
|
Image 2.3

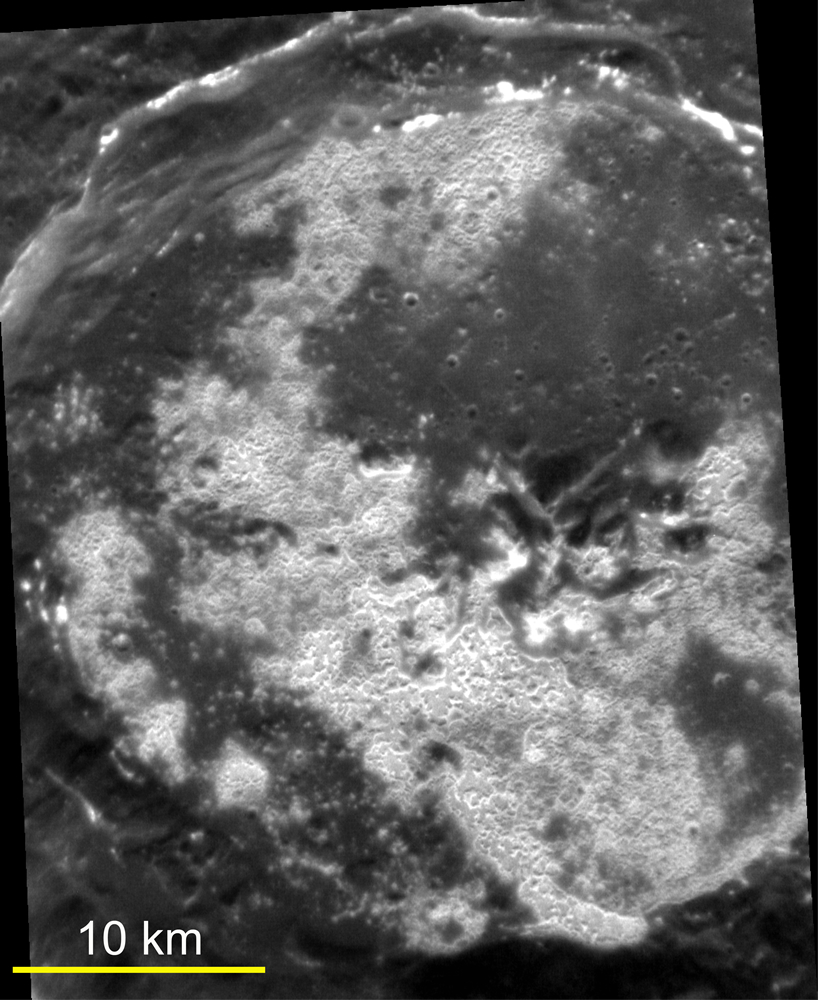
Sander crater, viewed from orbit at about 10 times better pixel resolution than during the flyby (Image 2.1). The high-resolution, targeted image reveals that the bright portions of the floor consist of large numbers of shallow irregular depressions ("hollows"), giving an etched appearance to the surface.
Credit: Courtesy of Science/AAAS
Click on image to enlarge.
|
|
Image 2.4a

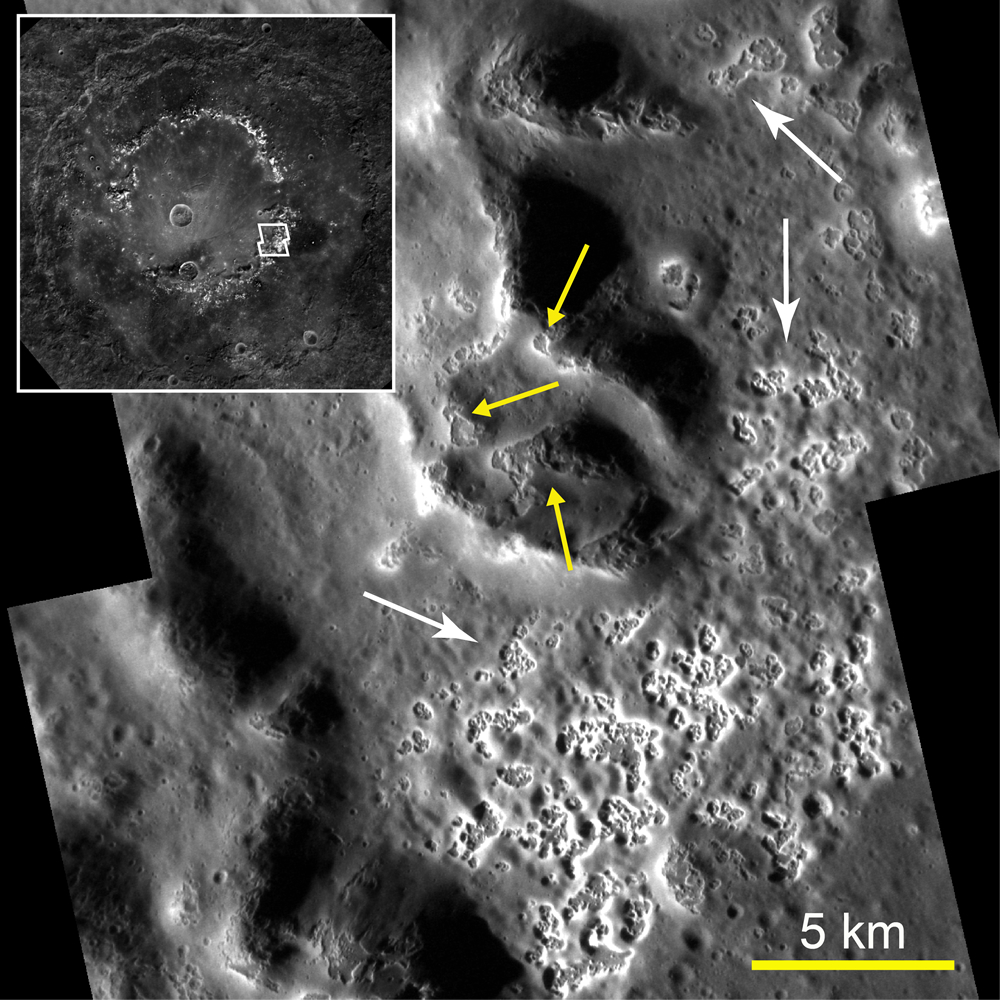
Portion of the interior of the Raditladi basin. Inset shows the location of the main image. The resolution of this image is about 30 times better than that of the flyby image in Image 2.2. Yellow arrows indicate hollows on the peak-ring mountains; white arrows point to hollows on the basin floor.
Credit: Courtesy of Science/AAAS
Click on image to enlarge.
|
Image 2.4b
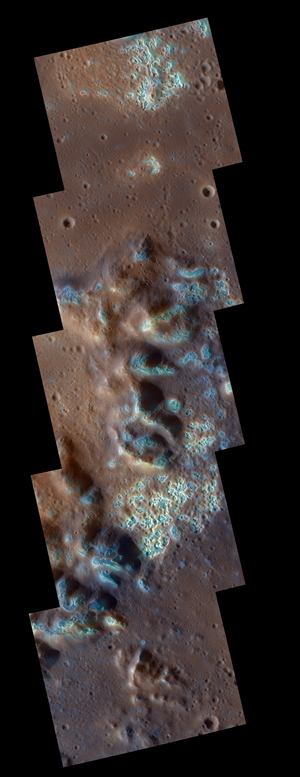
View of a larger section of the floor and peak-ring mountains of the Raditladi impact basin, including the area in Image 2.4a. The individual frames in the mosaic are about 20 km wide. The image was created by merging high-resolution monochrome images from MESSENGER's Narrow Angle Camera with a lower-resolution enhanced-color image obtained by the Wide Angle Camera.
Credit: NASA/Johns Hopkins University Applied Physics Laboratory/Carnegie Institution of Washington
Click on image to enlarge.
|
|
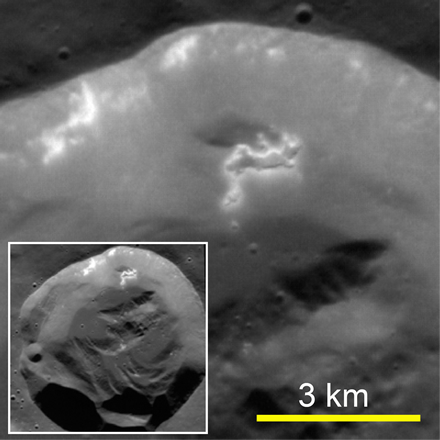
Image 2.5
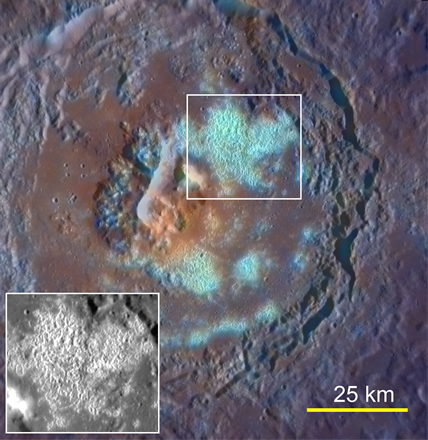
Another example of a large crater (Tyagaraja, 97 km in diameter) with a floor partially covered by large numbers of coalesced hollows. Here a high-resolution monochrome image has been combined with a lower-resolution enhanced-color image. The hollows appear in cyan, a result of their high reflectance and bluish color relative to other parts of the planet. The large pit in the center of the crater may be a volcanic vent, from which the orange material erupted.
Credit: Courtesy of Science/AAAS
Click on image to enlarge.
|
|
Image 2.6
This high-resolution view shows a small, fresh 15-km-diameter impact crater (inset) at a high northern latitude on Mercury. Bright material is exposed on the upper part of the south-facing wall, and hollows are present on a section of the wall that has slid partway down toward the floor.
Credit: Courtesy of Science/AAAS
Click on image to enlarge.
|
|
Presenter #3 |
Patrick N. Peplowski, Staff Scientist
Planetary Exploration Group, Space Department, Johns Hopkins University Applied Physics Laboratory, Laurel, MD
Image 3.1
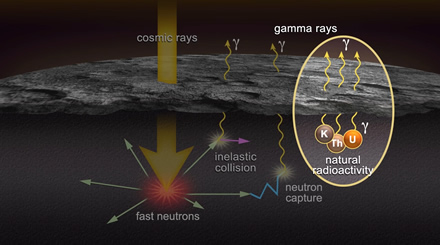
Schematic illustration of the operation of MESSENGER's Gamma-Ray Spectrometer (GRS). Galactic cosmic rays interact with the surface of Mercury to a depth of tens of centimeters, producing high-energy (“fast”) neutrons. These neutrons further interact with surface material, resulting in the emission of gamma rays with energies characteristic of the emitting elements and low-energy (“slow”) neutrons. Naturally occurring radioactive elements such as potassium (K), thorium (Th), and uranium (U) also emit gamma rays. Detection of the gamma rays and neutrons by GRS allows determination of the chemical composition of the surface.
Credit: NASA/Johns Hopkins University Applied Physics Laboratory/Carnegie Institution of Washington
Click on image to play the movie.
|
|
Image 3.2
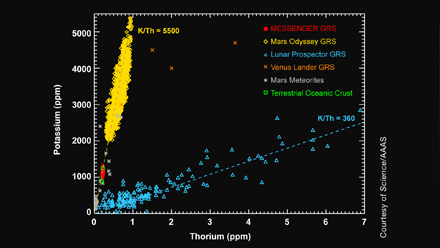
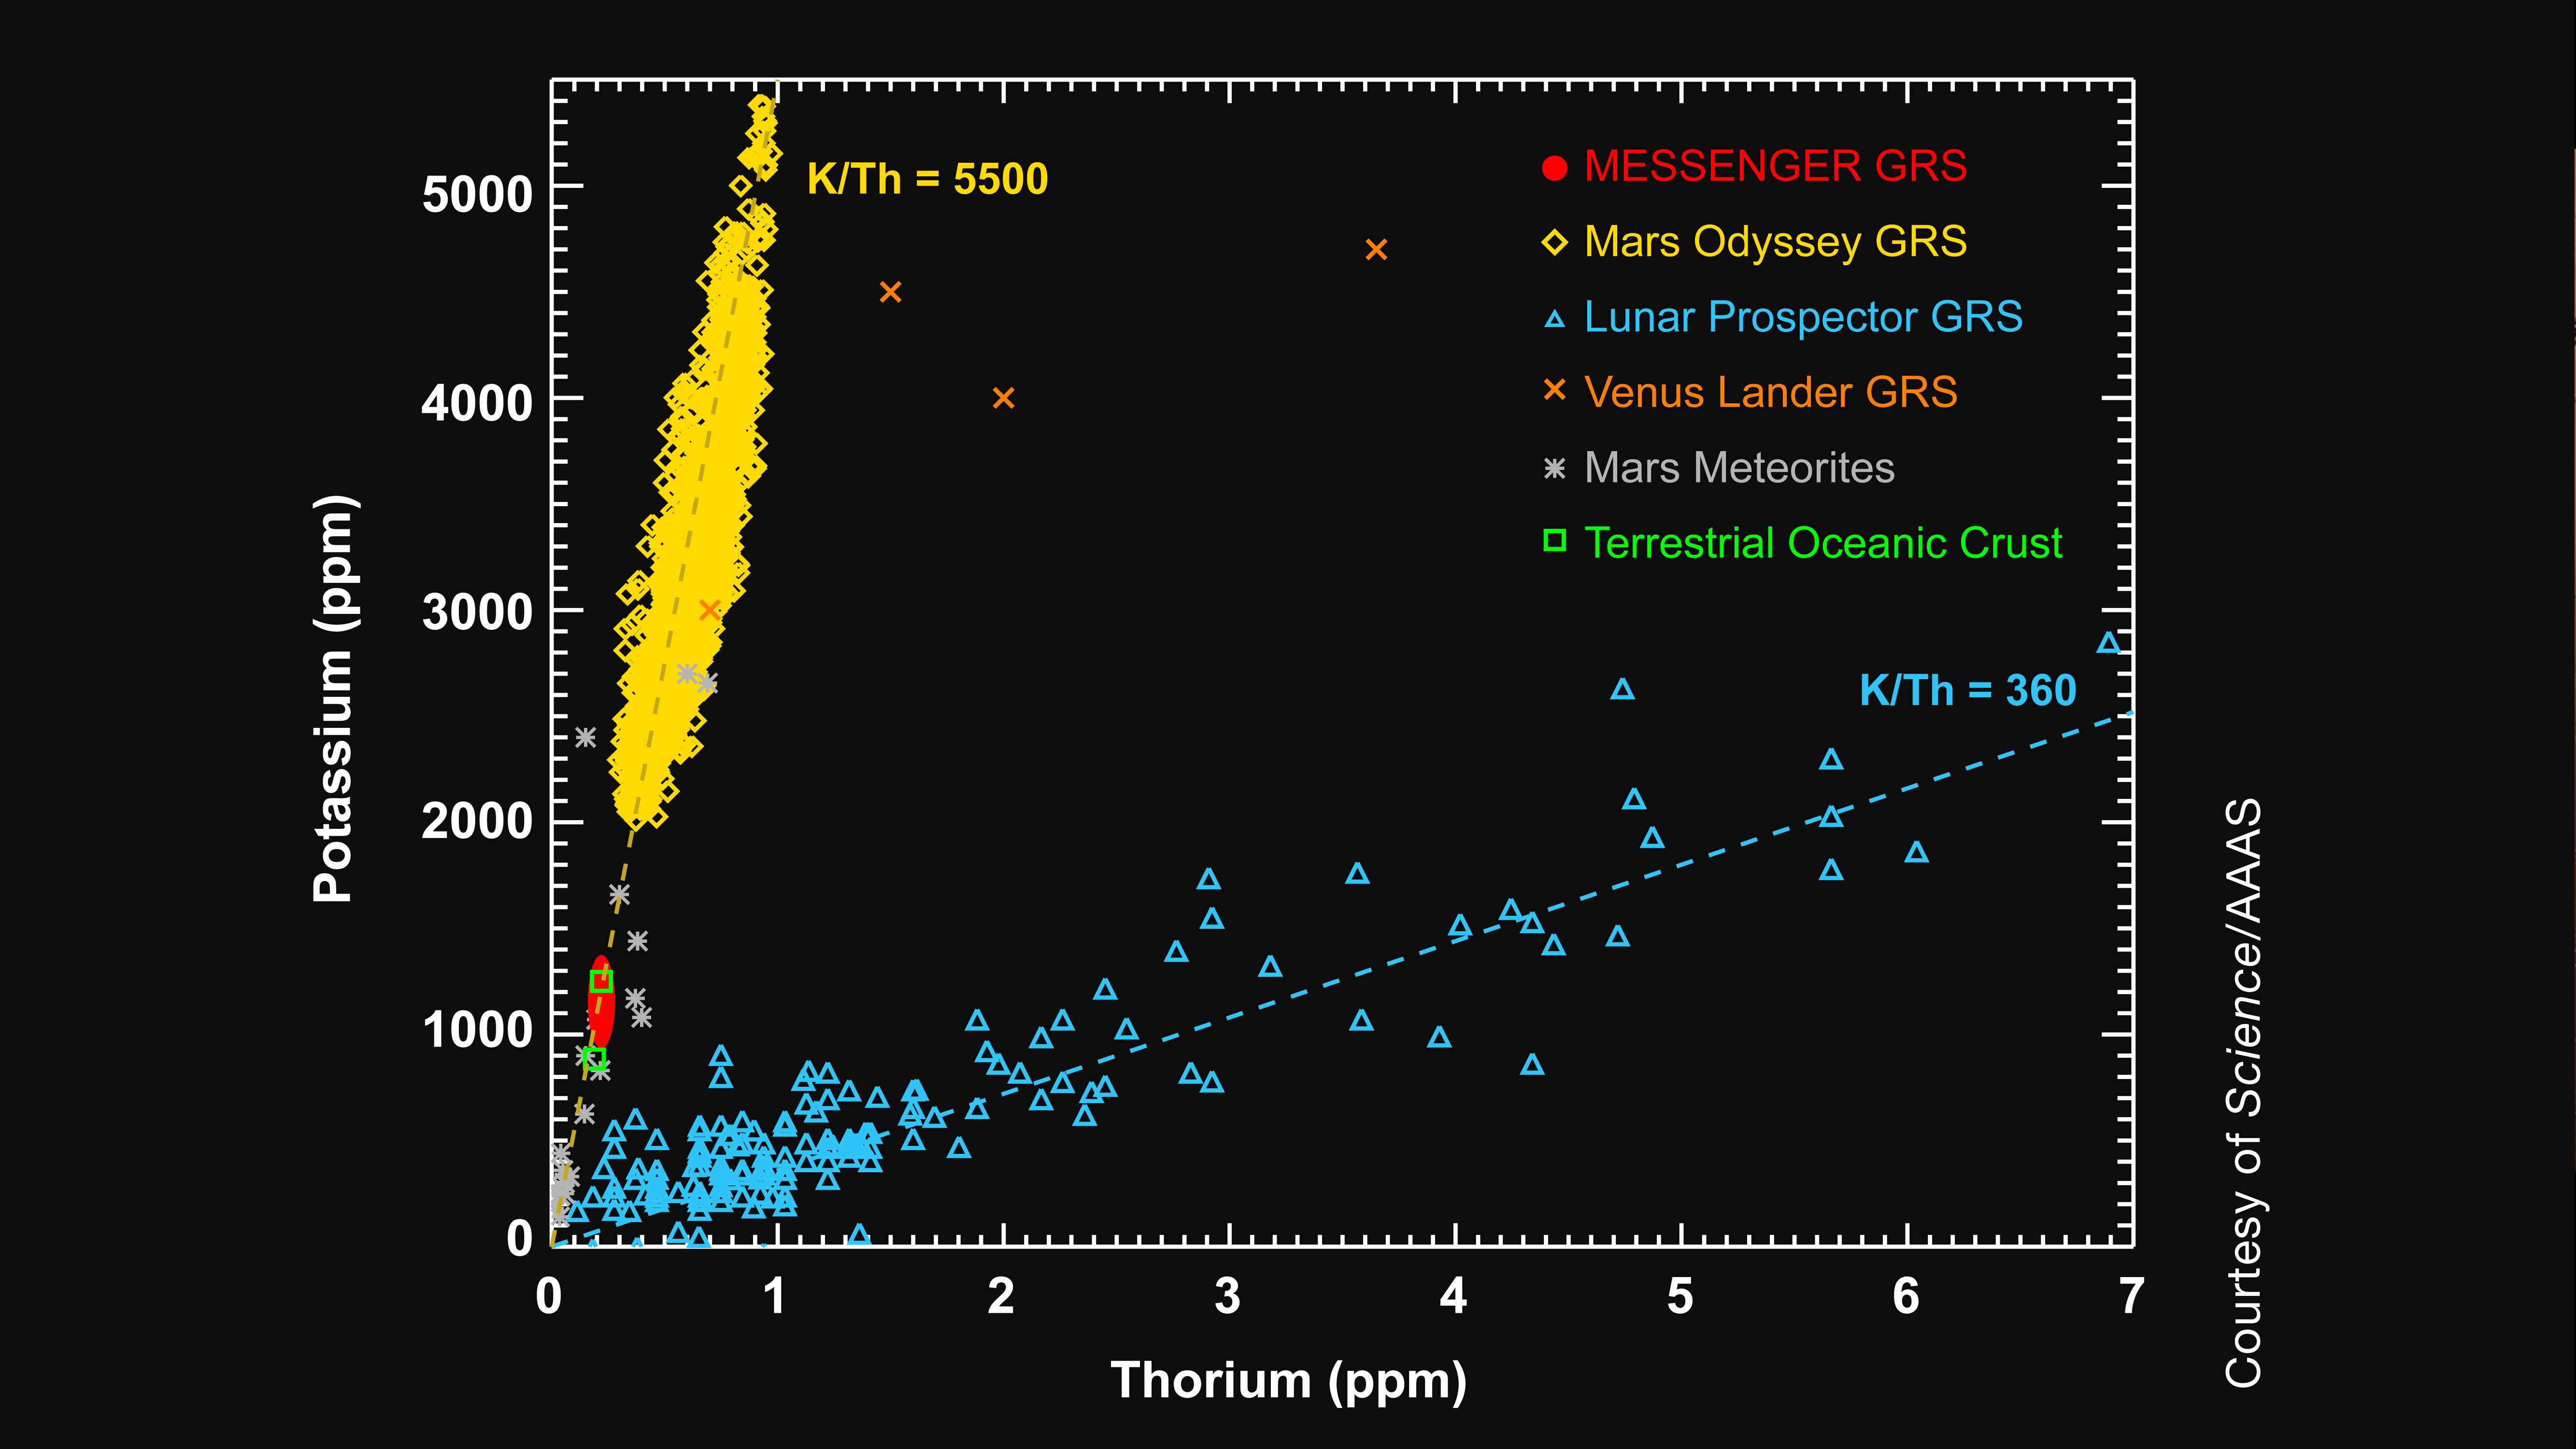
The abundance of potassium (K) and thorium (Th) on the surface of Mercury as measured by the MESSENGER Gamma-Ray Spectrometer. These values are compared to similar measurements of the K and Th content of Venus, Earth, the Moon, and Mars. Because K is a volatile element and Th a refractory one, this ratio is a sensitive measure of high-temperature processes that fractionate elements by volatility. For example, the ratio for the Moon (360) is much lower than that for Earth (3000), reflecting volatile loss during the Moon's formation by a giant impact. The ratio for Mercury is comparable to that of the other terrestrial planets, indicating that Mercury is not highly depleted in volatile elements, ruling out some models for its formation and early history. This finding is supported by the identification of sulfur on the surface by the MESSENGER X-Ray Spectrometer.
Credit: Courtesy of Science/AAAS
Click on image to enlarge.
|
|
Image 3.3
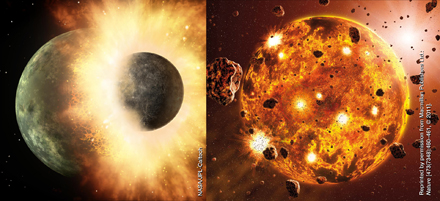
Theories of Mercury’s formation have been developed to explain its unusually large metal-to-silicate ratio compared with Venus, Earth, and Mars. These theories generally fall into one of two categories: physical removal of silicates or differences in the composition material from which Mercury formed compared with other solar system bodies. Two of the physical models invoke one or more giant impacts (left) or the vaporization of surface by a hot solar nebula to remove the planet’s original crust and outer mantle. Chemical models describe the material from which Mercury formed, for example, refractory condensates or primitive precursory material (right). The abundances of potassium, thorium, and uranium on the surface of Mercury measured by the MESSENGER Gamma-Ray Spectrometer rule out the giant impact, vaporization, and refractory condensation models. Formation from primitive material, similar to some forms of chondritic meteorites, is consistent with the GRS measurements.
Credit: NASA/JPL/Caltech (left); Reprinted by permission from Macmillan Publishers Ltd: Nature [473(7348):460-461, © 2011] (right)
Click on image to enlarge.
|
|
Presenter #4 |
Thomas H. Zurbuchen, Professor of Space Science and Aerospace Engineering
University of Michigan College of Engineering, Ann Arbor, MI
Image 4.1a
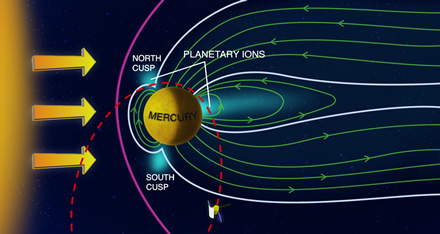
Schematic view of Mercury’s magnetosphere and heavy plasma ion flux. Mercury’s planetary magnetic field largely shields the surface from the supersonic solar wind emanating continuously from the Sun. MESSENGER has been in a near-polar, highly eccentric orbit (dashed red line) since 18 March 2011. Maxima in heavy ion fluxes observed from orbit are indicated in light blue.
Credit: Courtesy of Science/AAAS
Click on image to enlarge.
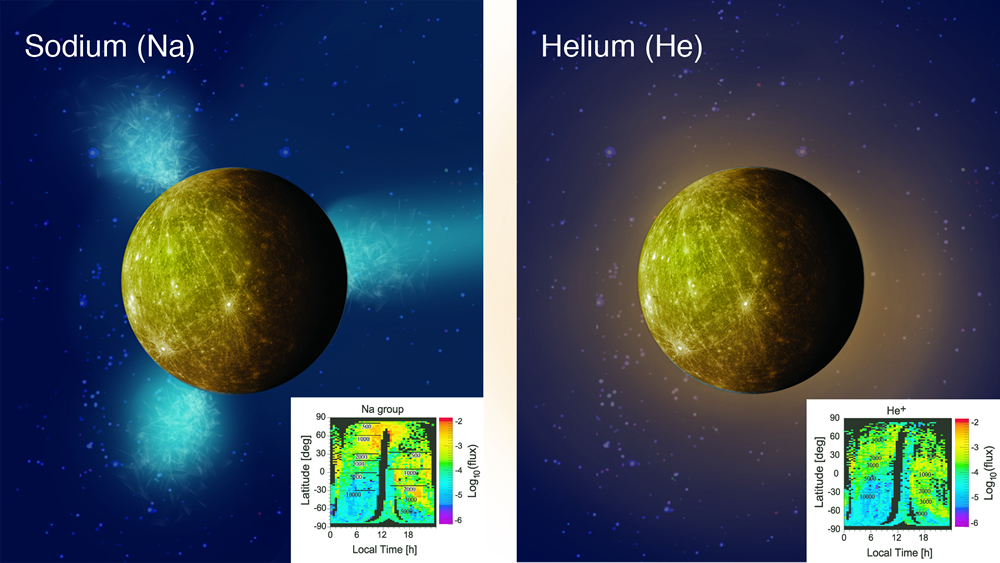
Image 4.1b

An artistic rendering of the global distribution of ionized sodium (Na) and helium (He) near the planet. Sodium exhibits distinct maxima near the magnetic cusps (Image 4.1a), where neutral atoms are likely liberated from the surface by solar wind ion bombardment. Helium is much more uniformly distributed, such as would be expected if the dominant source process were evaporation from a helium-saturated surface.
Credit: University of Michigan; inset courtesy of Science/AAAS
Click on image to enlarge.
|
|
Image 4.2
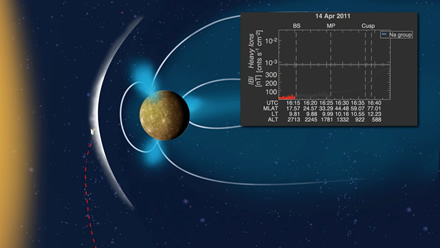
Visualization of measurements of sodium-group ion flux (blue) and magnetic field (red) during MESSENGER’s orbit on 14 April 2011. Sodium-group ions are measured throughout the entire magnetosphere, but they strongly peak near the magnetic cusps, where the magnetic protection of the planet is least effective. Measurements from more than 120 orbits were used to assemble a global picture of Mercury's three-dimensional exosphere.
Credit: University of Michigan; inset courtesy of Science/AAAS
Click on image to play the movie.
|
|
The NASA MESSENGER Science Update will take place on Thursday, September 29, 2011, at 2 p.m. EDT. Audio of the teleconference will be streamed live at: http://www.nasa.gov/newsaudio.