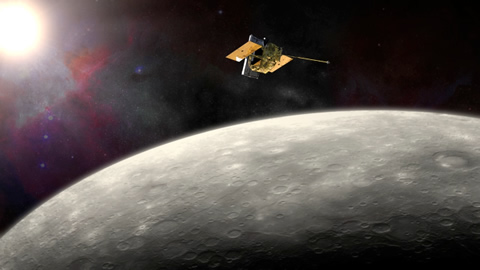
NASA's MErcury Surface, Space ENvironment, GEochemistry, and Ranging (MESSENGER) spacecraft entered orbit around Mercury on March 18, becoming the first spacecraft ever to do so. MESSENGER’s instruments are performing the first complete reconnaissance of the planet’s geochemistry, geophysics, geologic history, atmosphere, magnetosphere, and plasma environment. After nearly three months in orbit, the payload is providing a wealth of new information about Mercury, as well as a few surprises.
Presenter #1 |
Brett W. Denevi, Staff Scientist
The Johns Hopkins University Applied Physics Laboratory, Laurel, Md.
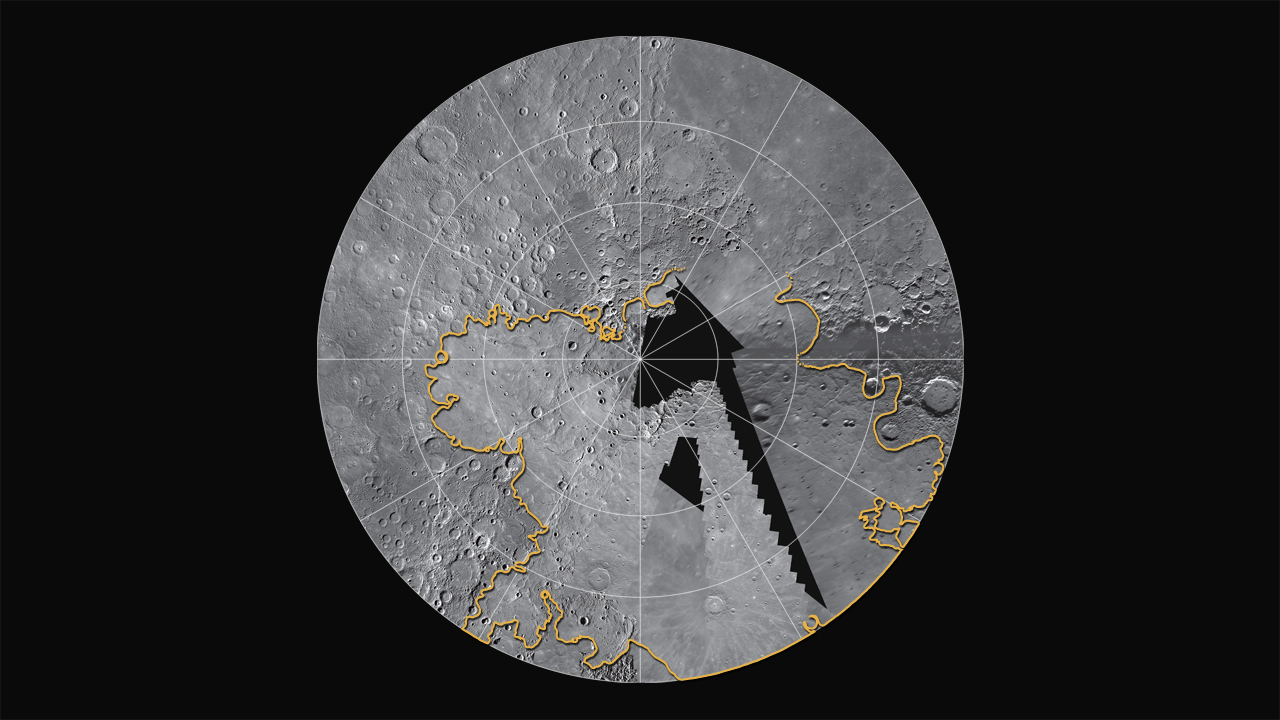
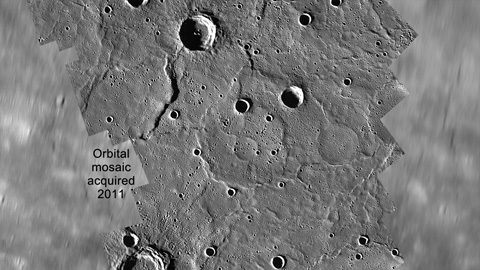
Image 1.1 Mercury’s north polar regions
Credit: NASA/The Johns Hopkins University Applied Physics Laboratory/Carnegie Institution of Washington
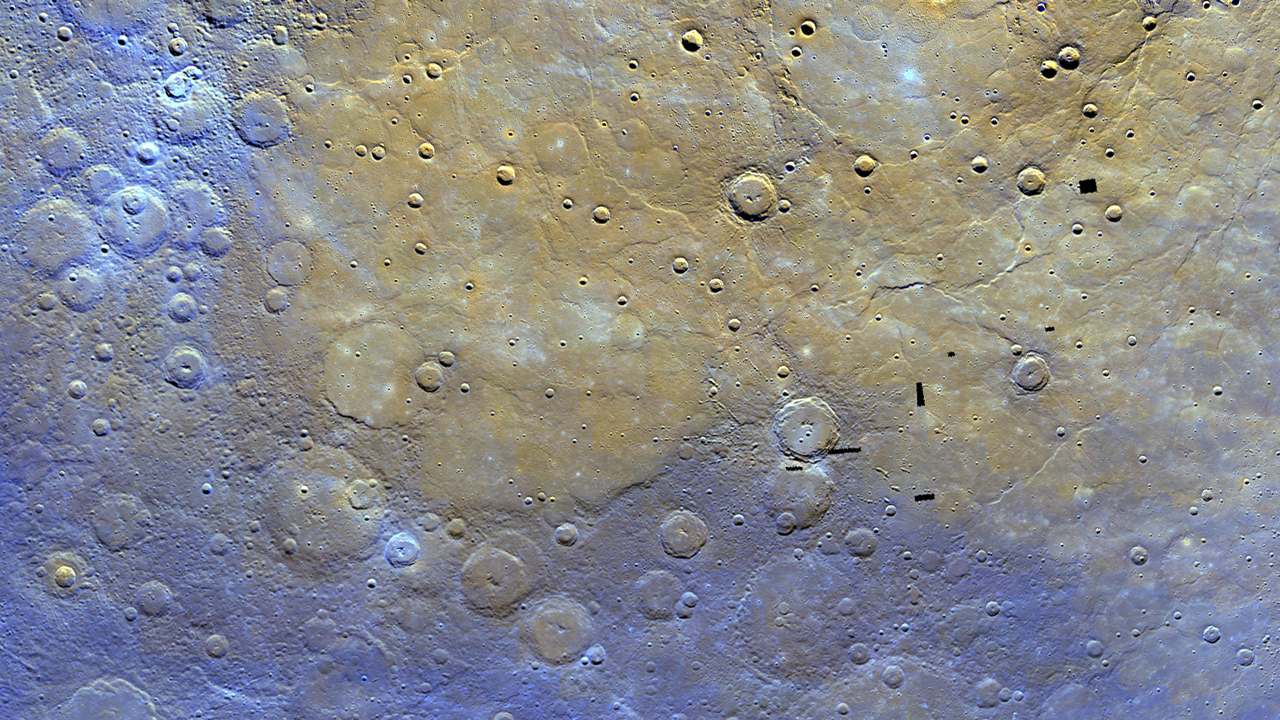
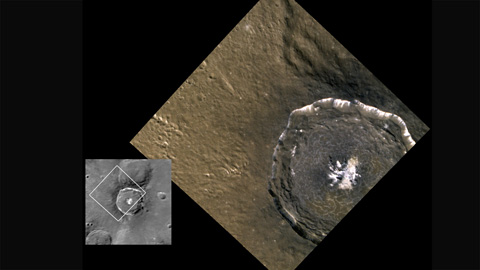
MESSENGER is currently filling in coverage of Mercury’s north polar region, which was seen only partially during the Mariner 10 and MESSENGER flybys. Flyby images indicated that smooth plains were likely important in Mercury’s northernmost regions. MESSENGER's orbital images show that the plains are among the largest expanses of volcanic deposits on Mercury, with thicknesses of several kilometers in many places. The estimated extent of these plains is outlined in yellow. This mosaic is a combination of flyby and orbital coverage in a polar stereographic projection showing latitudes from 50° to 90° N. The longitude at the 6 o'clock position is 0°.
Click on image to enlarge.
|
|
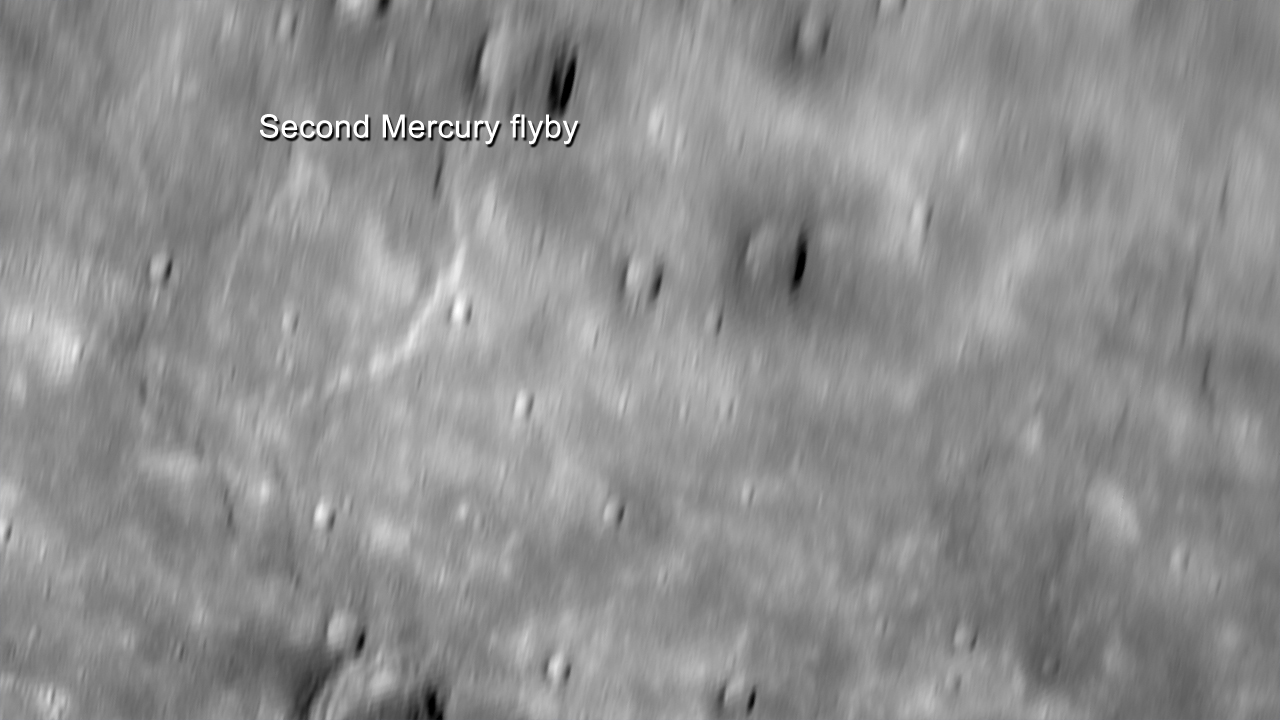
Image 1.2a Limitations of flyby imaging: an example
Credit: NASA/The Johns Hopkins University Applied Physics Laboratory/Carnegie Institution of Washington
Although image coverage of Mercury from the MESSENGER and Mariner 10 flybys extended to approximately 98% of the surface, such images were obtained at varying resolution and lighting and often at extreme viewing geometries. This scene at 74° N, 336° E, shows a region viewed during MESSENGER's second flyby, but its high-latitude location made the recognition of surface features a difficult task. The scene is approximately 275 km from top to bottom.
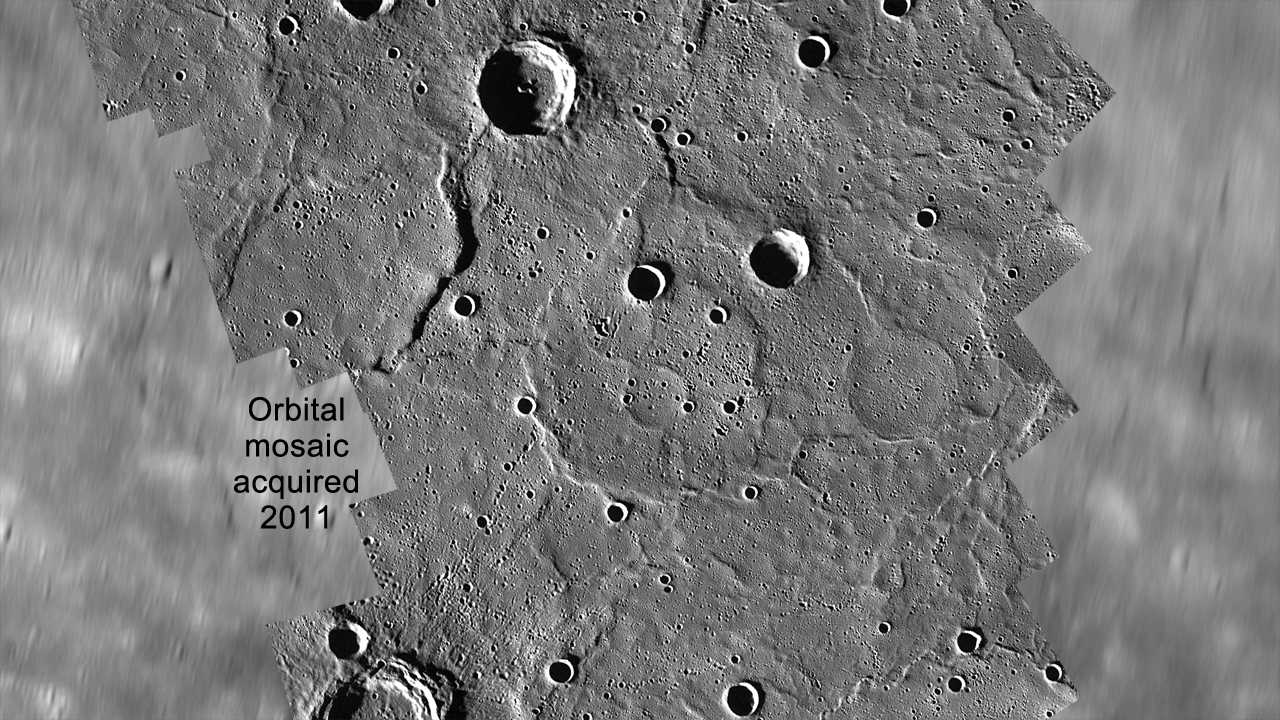
Image 1.2b Advantages of a global perspective: the same example
Credit: NASA/The Johns Hopkins University Applied Physics Laboratory/Carnegie Institution of Washington
MESSENGER’s orbital images have been overlaid on an image from the second flyby shown in Image 1.2a. Even for previously imaged portions of the surface, orbital observations reveal a new level of detail. This region is part of the extensive northern plains, and evidence for a volcanic origin can now be seen. Several examples of “ghost” craters, preexisting craters that were buried by the emplacement of the plains, are seen near the center of the mosaic.
Click on image to enlarge.
|
|
Image 1.3a Northern plains in color
Credit: NASA/The Johns Hopkins University Applied Physics Laboratory/Carnegie Institution of Washington
An example of MESSENGER’s color base map imaging campaign, which will collect global images acquired through eight filters between wavelengths of 430 and 1000 nm at an average resolution of 1.2 km/pixel. The northern plains are seen here to be distinctive in color and thus composition from the surrounding terrain. The mosaicked images are shown with the 1000, 750, and 430 nm images in red, green, and blue, respectively. The scene is centered at 73° N, 300° E.
Click on image to enlarge.
Image 1.3b Northern plains in enhanced color
Credit: NASA/The Johns Hopkins University Applied Physics Laboratory/Carnegie Institution of Washington
The same scene as that in Image 1.3a is shown after the application of a statistical method that highlights differences among the eight color filters, making variations in color and composition easier to discern.
Click on image to enlarge.
|
|
Image 1.4 Animation of global imaging coverage and unusual impact melt
Credit: NASA/The Johns Hopkins University Applied Physics Laboratory/Carnegie Institution of Washington
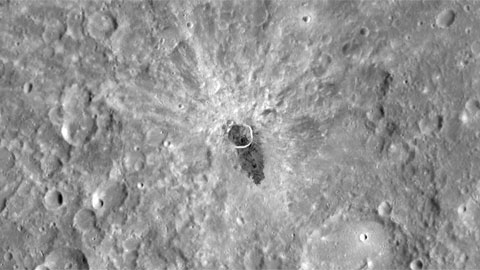
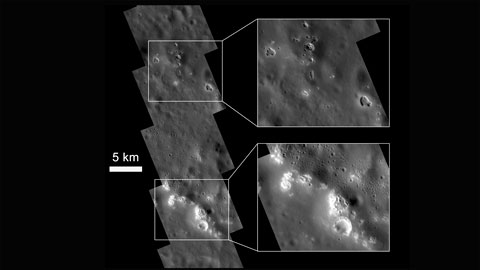
Imaging for MESSENGER’s global monochrome base map, collected at an average resolution of 250 m/pixel, is well underway. This animation shows the current monochrome coverage, centered at 240° E, and zooms in to highlight one of the many striking features seen during the first few months of orbital operations. At 9.0° S, 254.7° E, impact melt flowed from an unnamed, 13-km-diameter impact crater, extending outward more than one crater diameter from the rim. In contrast to impact melt observed at other craters on Mercury, this flow is low in reflectance and appears to be compositionally distinct from its surroundings—a confirmation that Mercury’s crust is heterogeneous both vertically and laterally on relatively small scales.
Click on image to play the movie. [ smaller file (55MB) ] (Macs, view with FireFox)
|
|
Image 1.5 Targeted color imaging: Degas crater
Credit: NASA/The Johns Hopkins University Applied Physics Laboratory/Carnegie Institution of Washington
This spectacular view of the crater Degas was obtained as a high-resolution targeted observation (90 m/pixel). Impact melt coats its floor, and as the melt cooled and shrank, it formed the cracks observed across the crater. For context, Mariner 10’s view of Degas is shown at left. Degas is 52 km in diameter and is centered at 37.1° N, 232.8° E.
Click on image to enlarge.
|
|
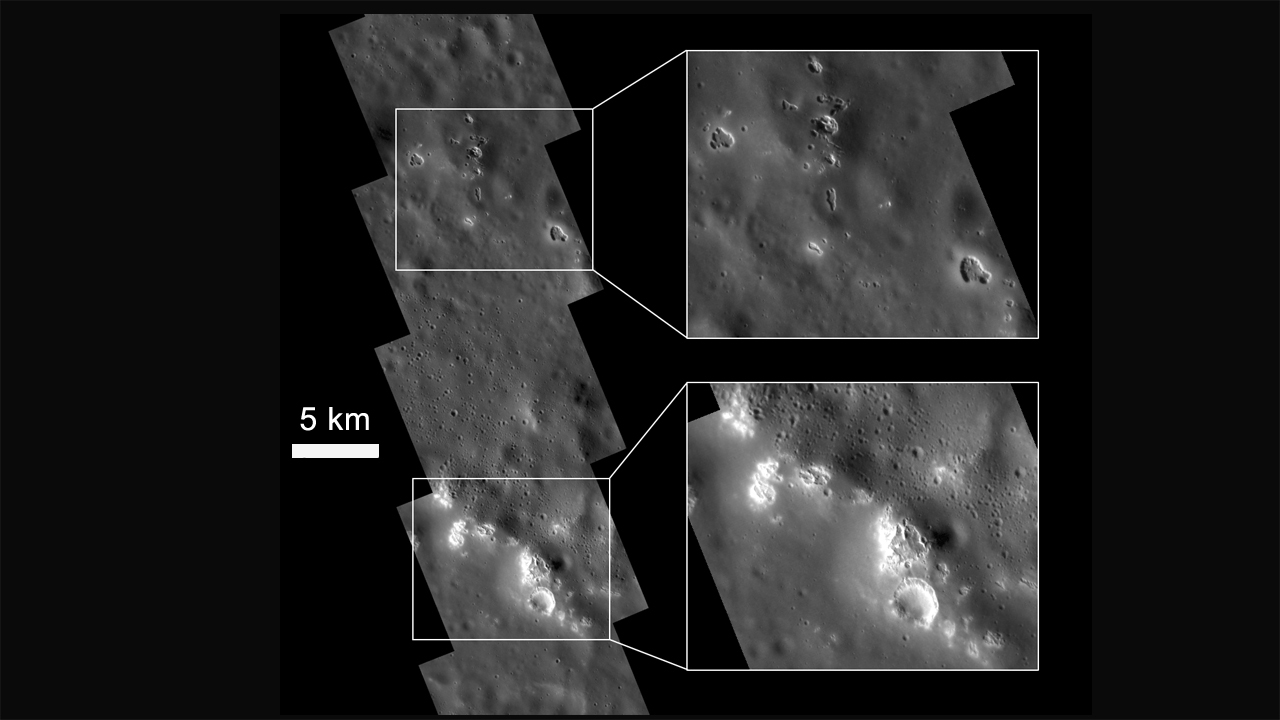
Image 1.6 Etched terrain
Credit: NASA/The Johns Hopkins University Applied Physics Laboratory/Carnegie Institution of Washington
Previous images hinted at unusual high-reflectance features associated with impact crater floors. High-resolution (21 m/pixel) monochrome images reveal these features to be rimless, irregular pits varying in size from hundreds of meters to up to several kilometers. These pits are often surrounded by diffuse halos of higher-reflectance material, and they are found associated with central peaks, peak rings, and rims of craters. The unusual etched appearance of these landforms may suggest a higher than expected volatile component in Mercury’s crust, and their sharp features are consistent with a relatively young age. The mosaic shown here is centered at 44.0° N, 290.9° E.
Click on image to enlarge.
|
|
Presenter #2 |
Larry R. Nittler, Staff Scientist, Department of Terrestrial Magnetism
Carnegie Institution of Washington, Washington, D.C.
Image 2.1 XRS in operation
Credit: NASA/The Johns Hopkins University Applied Physics Laboratory/Carnegie Institution of Washington
Schematic illustration of the operation of MESSENGER's X-ray Spectrometer (XRS). When X-rays emitted from the Sun’s corona strike the planet, they can induce X-ray fluorescence from atoms at the surface. Detection of these fluorescent X-rays by the XRS allows determination of the surface chemical composition.
Click on image to play the movie. [ smaller file (2.4MB) ] (Macs, view with FireFox)
|
|
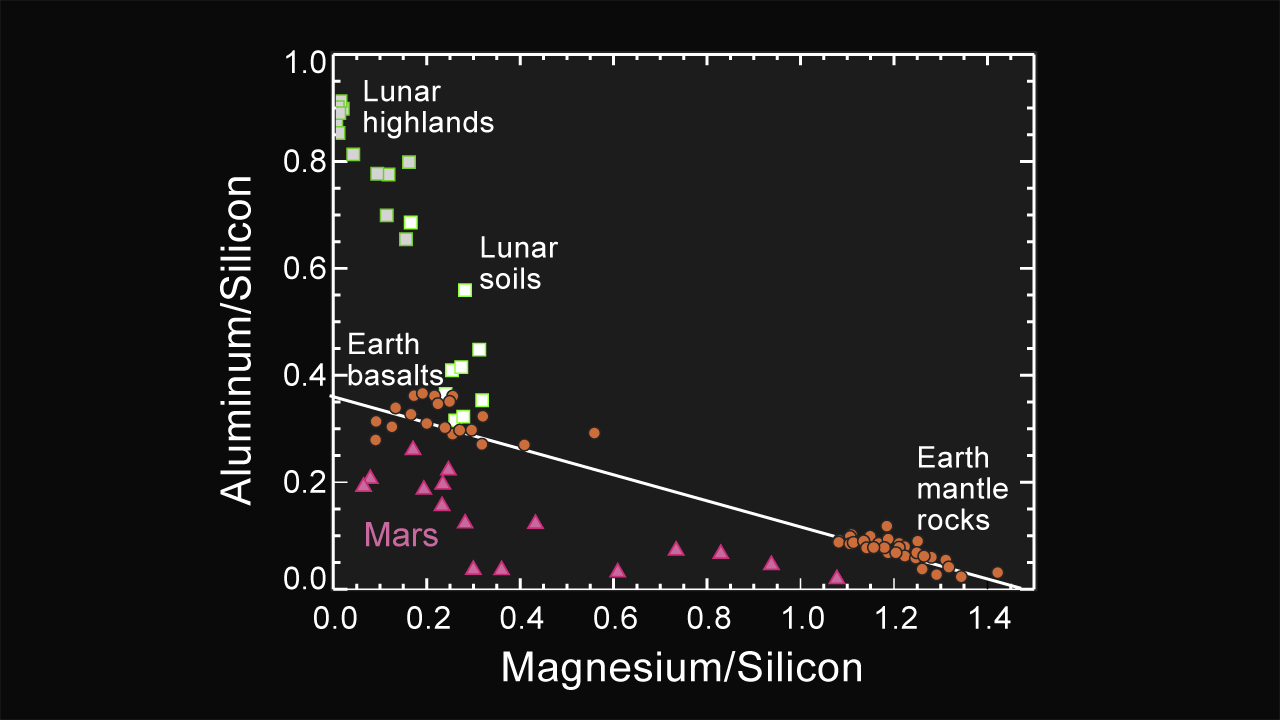
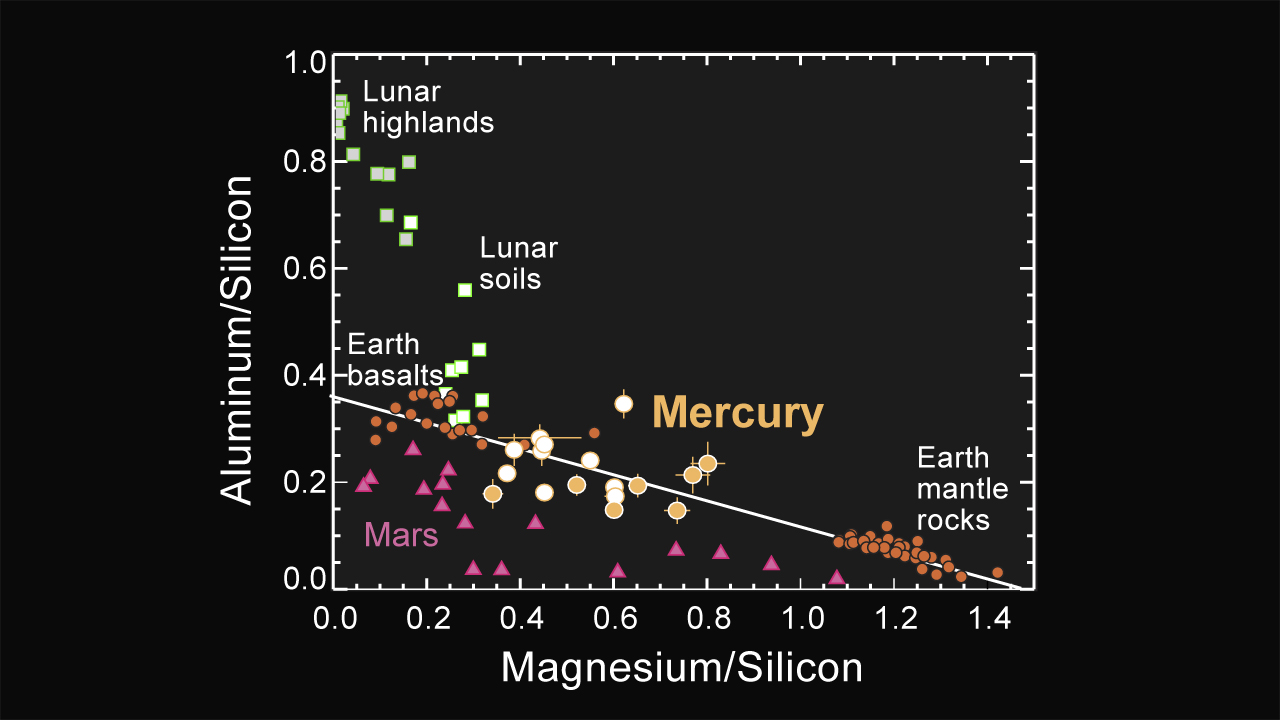
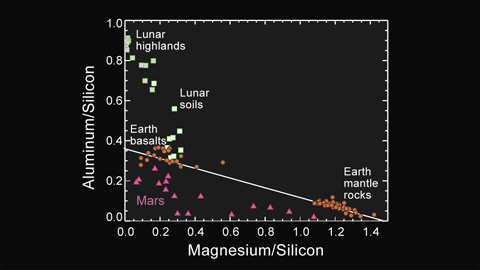
Image 2.2a Major-element composition of Mercury surface materials
Credit: NASA/The Johns Hopkins University Applied Physics Laboratory/Carnegie Institution of Washington
Major-element composition of representative rocks and soils from Earth, Moon, and Mars as displayed on a graph of the ratio by weight of aluminum over silicon versus that of magnesium over silicon.
Click on image to enlarge.
Image 2.2b Major-element composition of Mercury surface materials
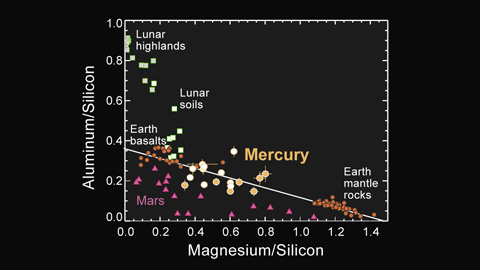
Credit: NASA/The Johns Hopkins University Applied Physics Laboratory/Carnegie Institution of Washington
Major-element composition of Mercury's surface materials, depicted on the same graph, as measured by the MESSENGER XRS. Mercury has lower Al/Si and higher Mg/Si than typical lunar surface materials and terrestrial basalts, indicating a lower fraction of the common mineral plagioclase feldspar.
Click on image to enlarge.
|
|
Image 2.3 GRNS in operation
Credit: NASA/The Johns Hopkins University Applied Physics Laboratory/Carnegie Institution of Washington
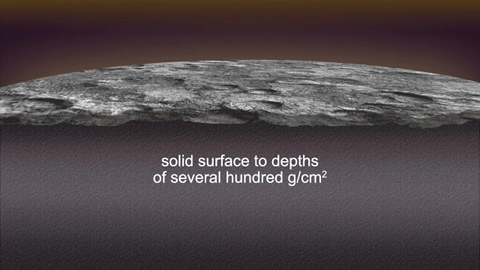
Schematic illustration of the operation of MESSENGER's Gamma-ray and Neutron Spectrometer (GRNS). Galactic cosmic rays interact with the surface of Mercury to a depth of tens of centimeters, producing high-energy (“fast”) neutrons. These neutrons further interact with surface material, resulting in the emission of gamma-rays with energies characteristic of the emitting elements and low-energy (“slow”) neutrons. Naturally occurring radioactive elements such as potassium (K), thorium (Th), and uranium (U) also emit gamma-rays. Detection of the gamma-rays and neutrons by GRNS allows determination of the chemical composition of the surface.
Click on image to play the movie. [ smaller file (3.4MB) ] (Macs, view with FireFox)
|
|
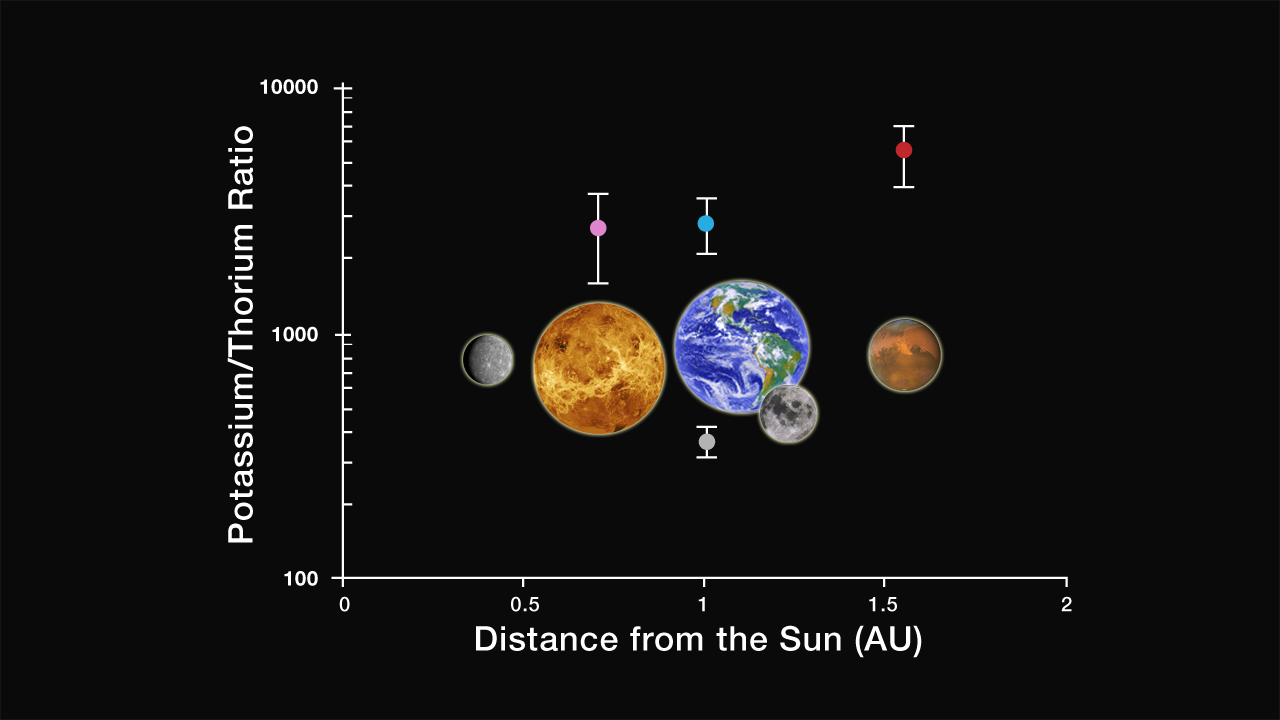
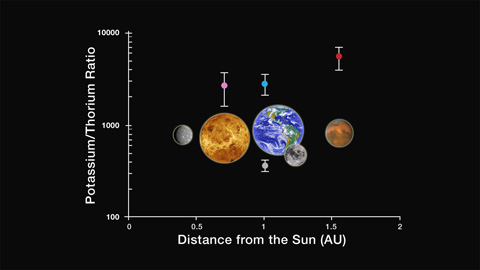
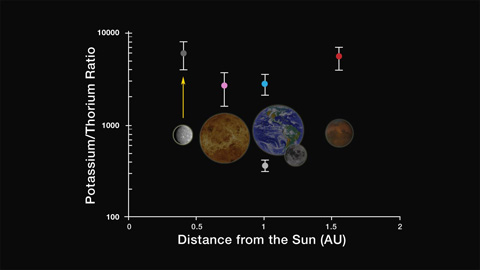
Image 2.4a K/Th in the inner solar system
Credit: NASA/The Johns Hopkins University Applied Physics Laboratory/Carnegie Institution of Washington
Image 2.4b K/Th in the inner solar system
Credit: NASA/The Johns Hopkins University Applied Physics Laboratory/Carnegie Institution of Washington
Ratio by weight of potassium to thorium for the terrestrial planets and Moon, plotted versus distance from the Sun. Because K is a volatile element and Th a refractory one, this ratio is a sensitive measure of thermal processes that fractionate elements by volatility. For example, the ratio for the Moon (360) is much lower than that for Earth (3000), reflecting volatile loss during the Moon's formation by a giant impact. The ratio for Mercury (~6000), determined by GRNS, is comparable to that of Venus, Earth, and Mars, indicating that Mercury is not highly depleted in volatile elements, ruling out some models for its formation and early history.
Click on image to enlarge.
|
|
Presenter #3 |
Sean C. Solomon, MESSENGER Principal Investigator
Carnegie Institution of Washington, Washington, D.C.
Image 3.1 MLA in operation
Credit: NASA/The Johns Hopkins University Applied Physics Laboratory/Carnegie Institution of Washington
Schematic illustration of the operation of MESSENGER’s Mercury Laser Altimeter (MLA). MLA ranges to Mercury whenever the spacecraft is within 1,800 km of the surface. Eight times per second, MLA’s laser emits a short (5 ns) pulse, which propagates along the laser transmitter’s line of sight to the surface, where a fraction of the pulse energy is reflected from the surface and propagates back to MLA’s four receiver telescopes. The time of flight of the laser pulse provides the distance to the portion of the surface from which signal was reflected. Knowledge of the spacecraft’s position then allows recovery of the elevation of the reflection point.
Click on image to play the movie. [ smaller file (28MB) ] (Macs, view with FireFox)
|
|
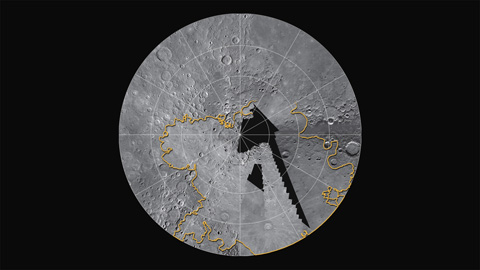
Image 3.2 MLA coverage to date
Credit: NASA/The Johns Hopkins University Applied Physics Laboratory/Carnegie Institution of Washington
This animation shows the MLA profiles acquired between 29 March and 24 May. Elevation along track (relative to a sphere of radius 2,440 km) is shown by the color scale. Note the broad area of generally low elevations in Mercury’s north polar region. The total range in elevation measured by MLA to date is more than 9 km. Orthographic projection centered on the north pole; the outmost circle corresponds to Mercury’s equator.
Click on image to play the movie. [ smaller file (32MB) ] (Macs, view with FireFox)
|
|
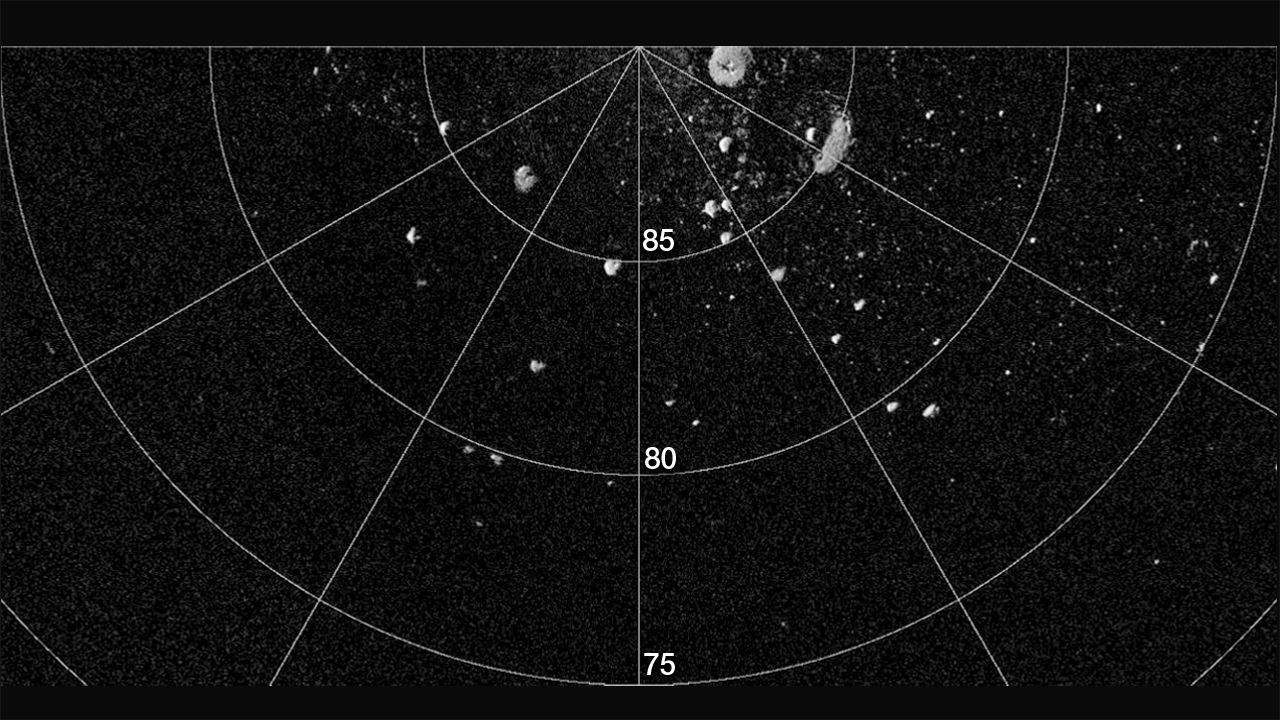
Image 3.3 Radar image of north polar deposits
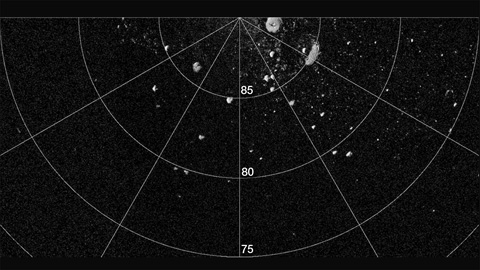 Credit: National Astronomy and Ionosphere Center, Arecibo Observatory Credit: National Astronomy and Ionosphere Center, Arecibo Observatory
A portion of a radar image of Mercury’s north polar region (latitudes indicated) obtained at the Arecibo Observatory. The bright features are polar deposits, areas of high radar backscatter thought to consist of water ice and perhaps other ices preserved on the cold, permanently shadowed floors of high-latitude impact craters.
Click on image to enlarge.
|
|
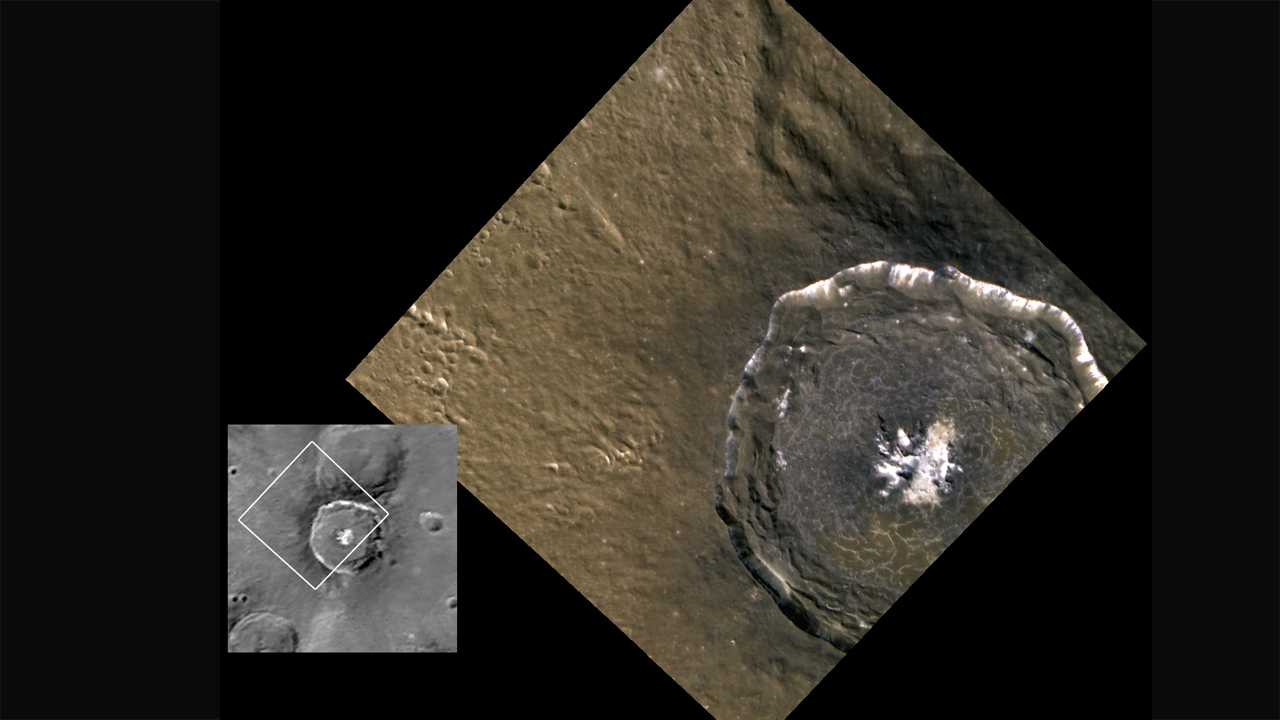
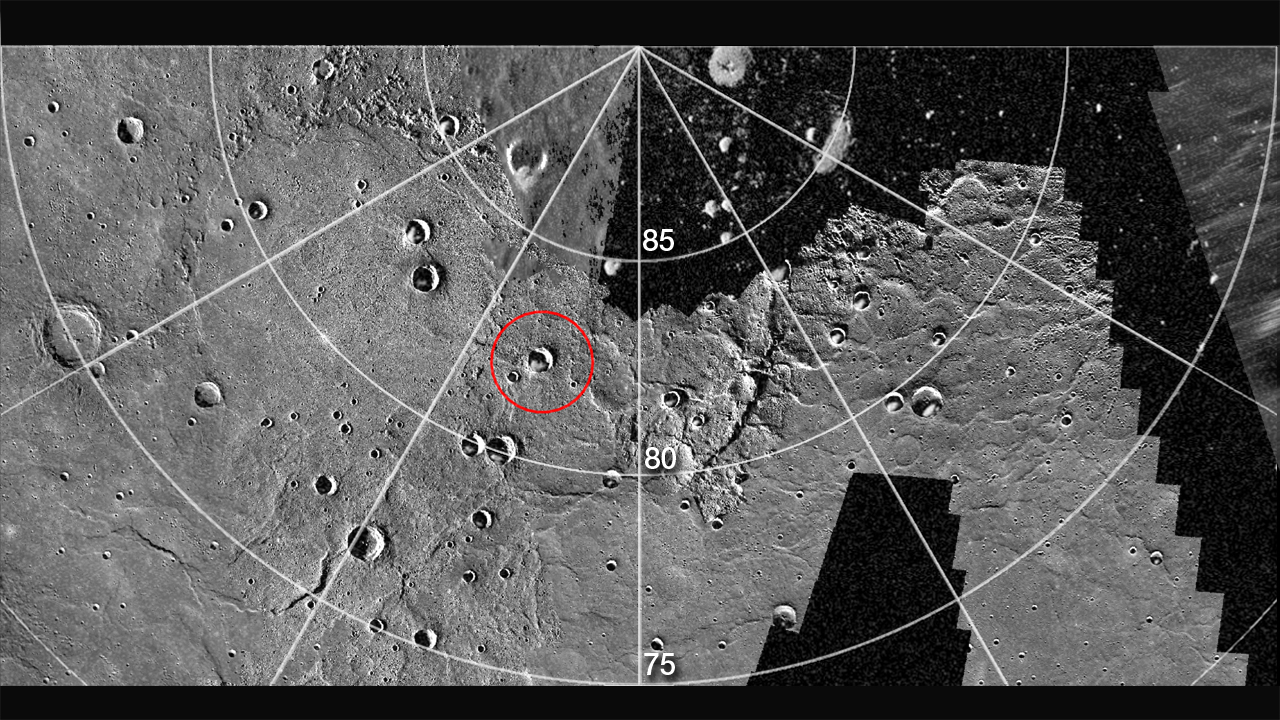
Image 3.4 Example of crater hosting polar deposits
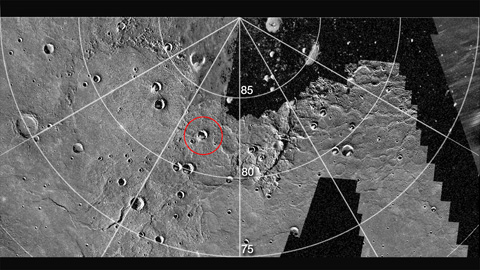
Credit: NASA/The Johns Hopkins University Applied Physics Laboratory/Carnegie Institution of Washington
A portion of a northern hemisphere mosaic of Mercury's surface (500 m/pixel) on which the radar image in Image 3.3 has been superposed. The prominent impact crater circled in red hosts an area of polar deposits and was profiled several times by MLA early in MESSENGER's science mapping phase. The crater is centered at 82.3°N, 342.8°E, and is 24 km in diameter.
Click on image to enlarge.
|
|
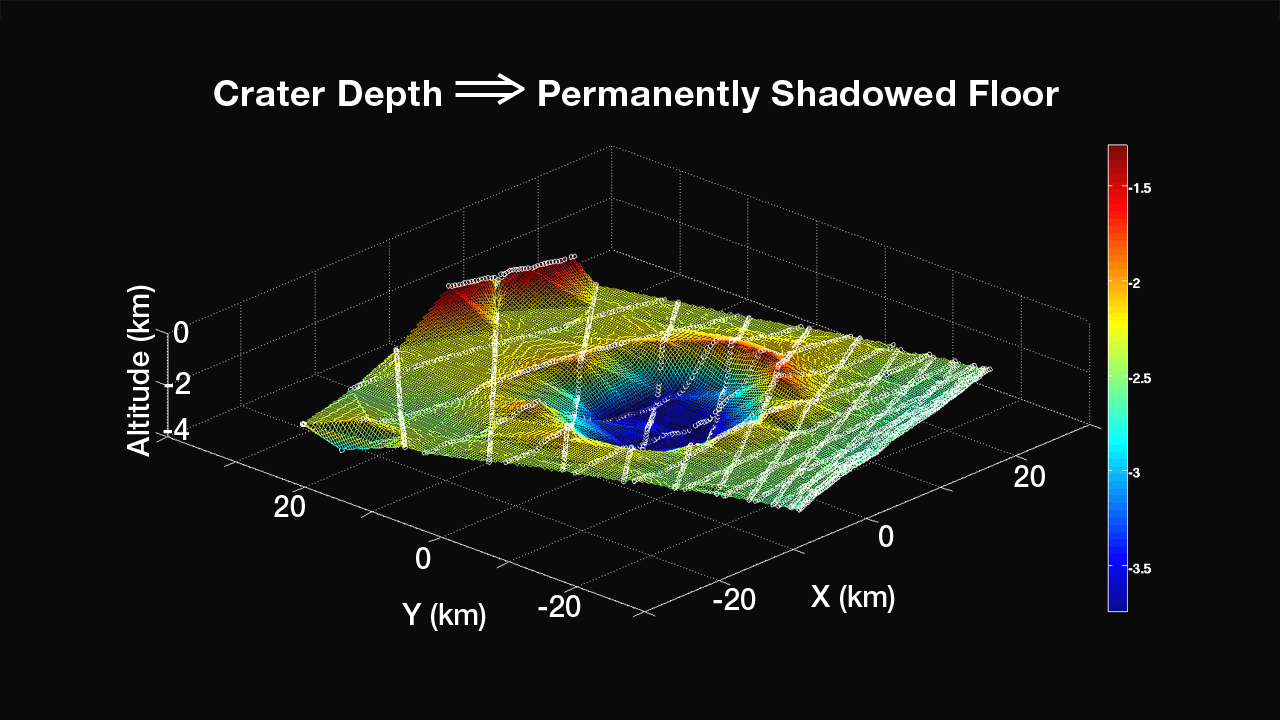
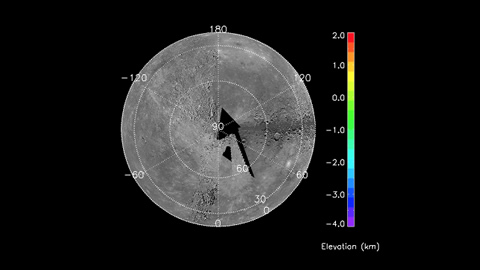
Image 3.5 Topographic profiles confirm permanently shadowed floor
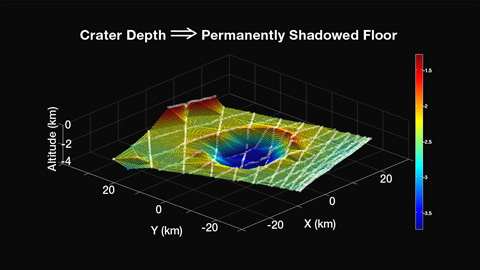
Credit: NASA/The Johns Hopkins University Applied Physics Laboratory/Carnegie Institution of Washington
This topographic contour map was constructed from the several MLA profiles (lines of white circles) that pass through and near the crater circled in Image 3.4. The color scale at right is in km, and north is at the 4 o’clock position. Calculations show that the topography of the crater is consistent with the prediction that the southernmost portion of the crater floor is in permanent shadow.
Click on image to enlarge.
|
|
Image 3.6 Magnetic equator versus longitude
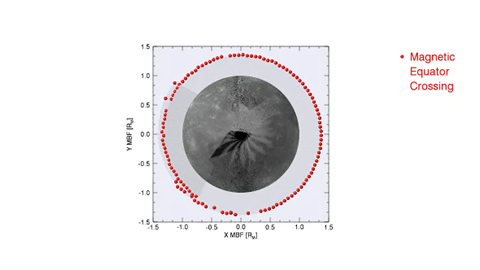
Credit: NASA/The Johns Hopkins University Applied Physics Laboratory/Carnegie Institution of Washington
This animation shows the location of Mercury’s magnetic equator determined on successive orbits as the point where the direction of the internal magnetic field is parallel to the spin axis of the planet. This magnetic equator is well north of the planet’s geographic equator (indicated by the horizontal gray line). The best-fitting internal dipole magnetic field is located about 0.2 Mercury radii, or 480 km, northward of the planet’s center. The dynamo mechanism in Mercury’s molten outer core responsible for generating the planet’s magnetic field therefore has a strong north-south asymmetry.
Click on image to play the movie. (Macs, view with FireFox)
|
|
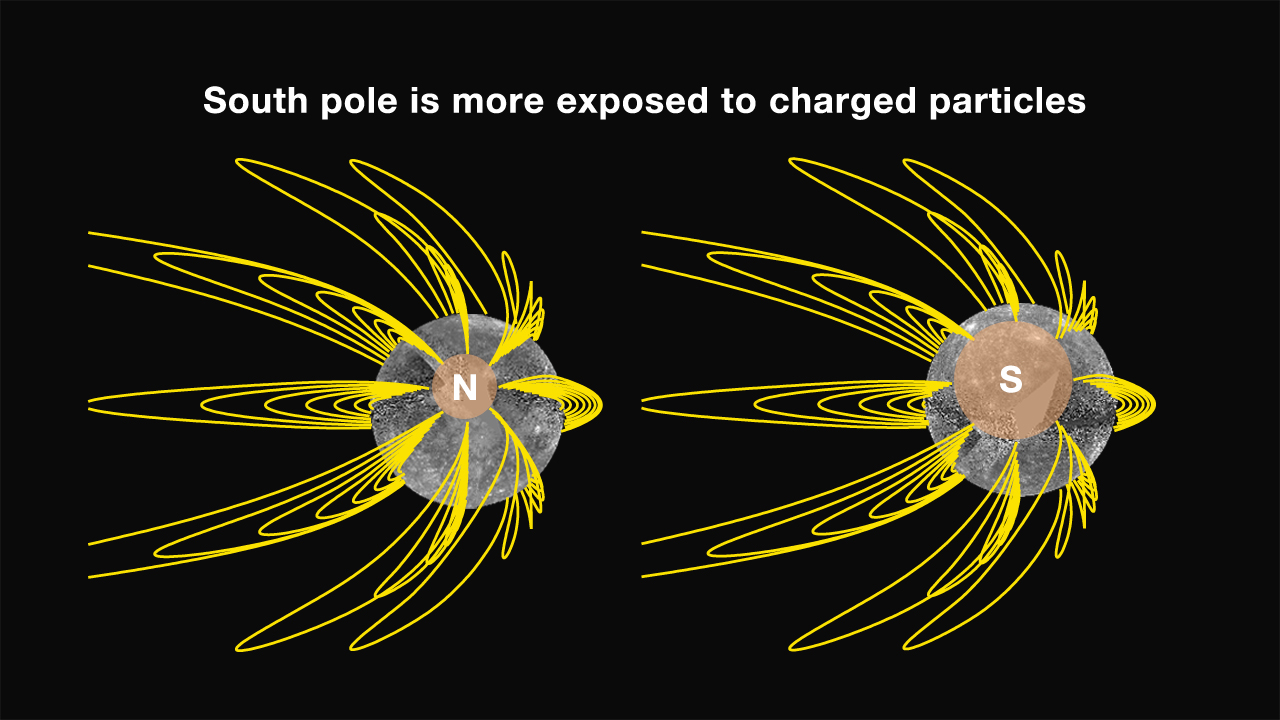
Image 3.7a Magnetic field lines differ at Mercury's north and south poles
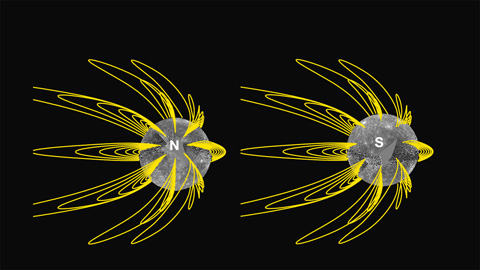
Credit: NASA/The Johns Hopkins University Applied Physics Laboratory/Carnegie Institution of Washington
Image 3.7b
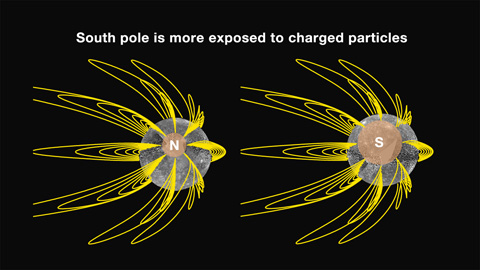 Credit: NASA/The Johns Hopkins University Applied Physics Laboratory/Carnegie Institution of Washington Credit: NASA/The Johns Hopkins University Applied Physics Laboratory/Carnegie Institution of Washington
As a result of the north-south asymmetry in Mercury's internal magnetic field, the geometry of magnetic field lines is different in Mercury's north and south polar regions. In particular, the magnetic "polar cap" where field lines are open to the interplanetary medium is much larger near the south pole. This geometry implies that the south polar region is much more exposed than in the north to charged particles heated and accelerated by solar wind–magnetosphere interactions. The impact of those charged particles onto Mercury's surface contributes both to the generation of the planet's tenuous atmosphere and to the "space weathering" of surface materials, both of which should have a north-south asymmetry given the different magnetic field configurations at the two poles.
Click on image to enlarge.
|
|
Presenter #4 |
Ralph L. McNutt Jr., MESSENGER Project Scientist
The Johns Hopkins University Applied Physics Laboratory, Laurel, Md.
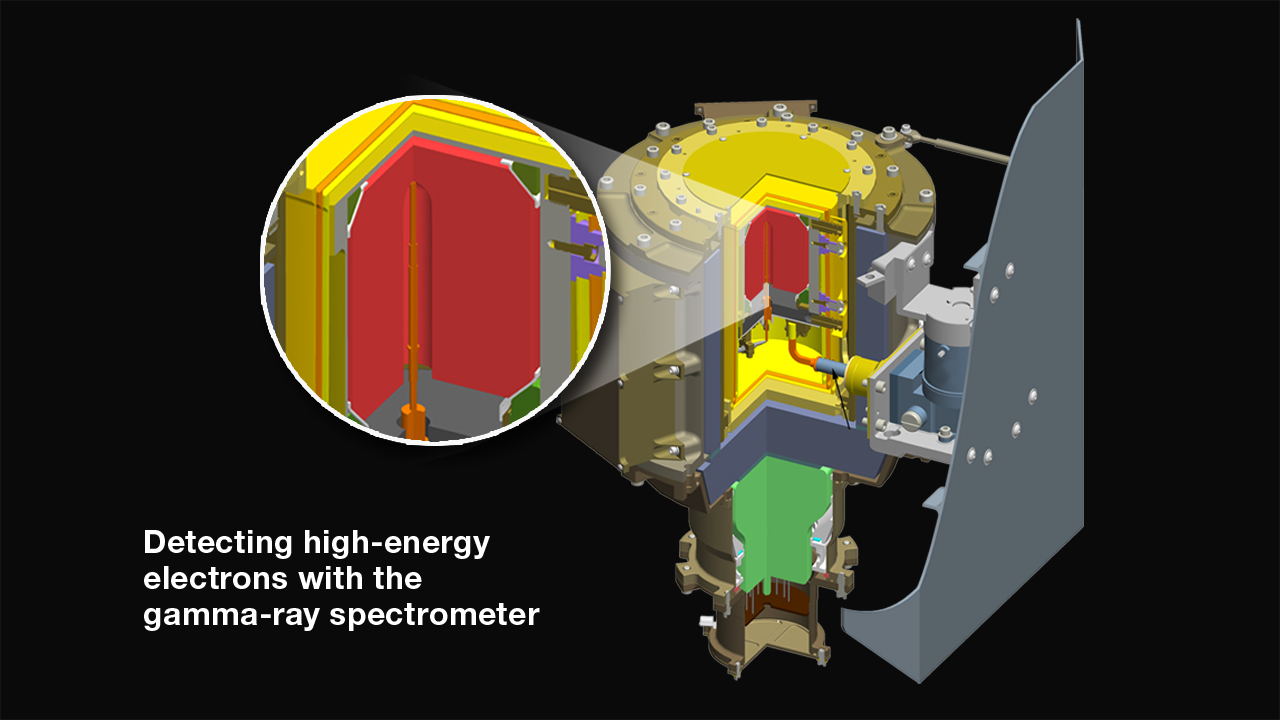
Image 4.1 GRS instrument cut-away
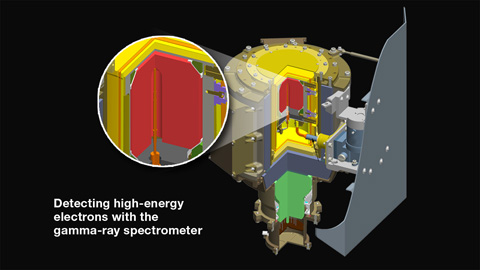
Credit: NASA/The Johns Hopkins University Applied Physics Laboratory/Carnegie Institution of Washington
MESSENGER’s Gamma-Ray Spectrometer (GRS), although designed to identify elements in Mercury’s surface material, can also respond to energetic electrons. In this instrument schematic, the “entrance” at the top of the drawing normally points toward Mercury’s surface. The enlargement depicts a schematic of the active sensor, a polished single crystal of the semiconducting element germanium, held at a constant temperature of 90 K (-297° F) by the instrument’s cooler. The crystal is 5 cm (2 inches) in both height and diameter.
Click on image to enlarge.
|
|
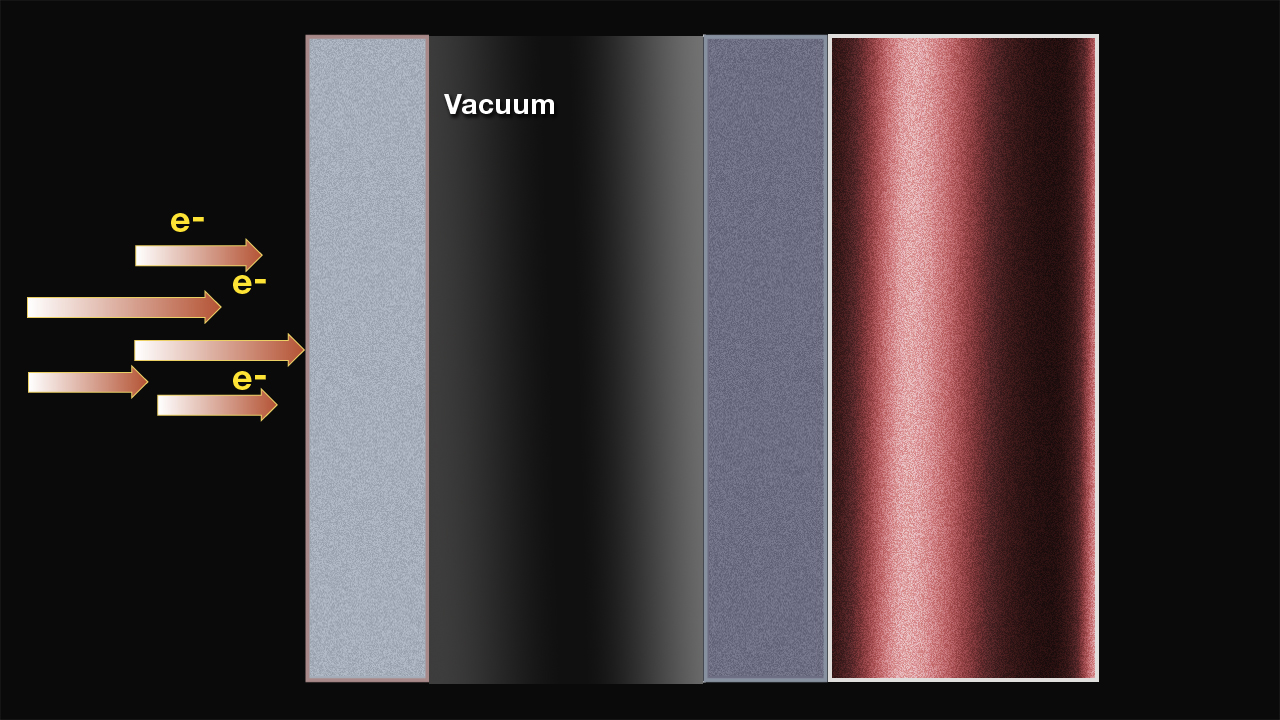
Image 4.2a High-energy electrons impacting the MESSENGER GRS
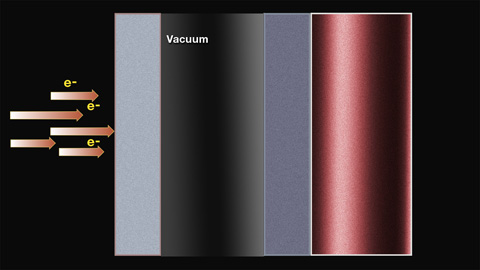
Credit: NASA/The Johns Hopkins University Applied Physics Laboratory/Carnegie Institution of Washington
Energetic electrons from Mercury’s magnetosphere in the vicinity of the MESSENGER spacecraft cannot reach the germanium crystal (reddish hued region) directly without impacting the instrument casing.
Click on image to enlarge.
Image 4.2b Impact of high-energy electrons produces X-rays
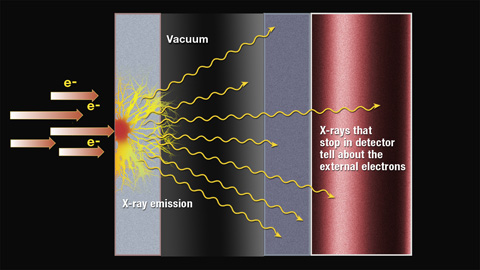
Credit: NASA/The Johns Hopkins University Applied Physics Laboratory/Carnegie Institution of Washington
The GRS casing is sufficiently thick to stop all of the electrons, but the impacts yield X-rays in much the same way that medical X-ray machines operate. A fraction of those X-rays reach the germanium detector, where they are registered and the data subsequently transmitted to Earth as part of the normal gamma-ray data. From these data, the properties of the electrons at the spacecraft can be deduced. The GRS channels affected are at energies well below those at which gamma rays from the planet are registered. The large size of the germanium crystal allows for higher time and energy resolution of the events than is possible with MESSENGER’s Energetic Particle Spectrometer (EPS). EPS observations provide information on the direction of the events.
Click on image to enlarge.
|
|
Image 4.3 Distribution of energetic electron events recorded by MESSENGER
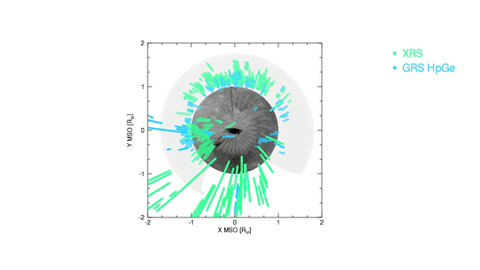
Credit: NASA/The Johns Hopkins University Applied Physics Laboratory/Carnegie Institution of Washington
This animation shows the locations at which energetic electrons were detected by MESSENGER between March 24 and June 3, 2011. In the coordinate system used (known as the Mercury solar orbital, or MSO, coordinates), the Sun is always in a fixed direction (here +X-axis). The events are well distributed in local time, but most are seen when the spacecraft is in the northern hemisphere. MESSENGER’s X-ray Spectrometer (XRS) responds to electrons initially with lower energies but in a manner analogous to the GRS.
Click on image to play the movie. [ smaller file (7MB) ] (Macs, view with FireFox)
|
|
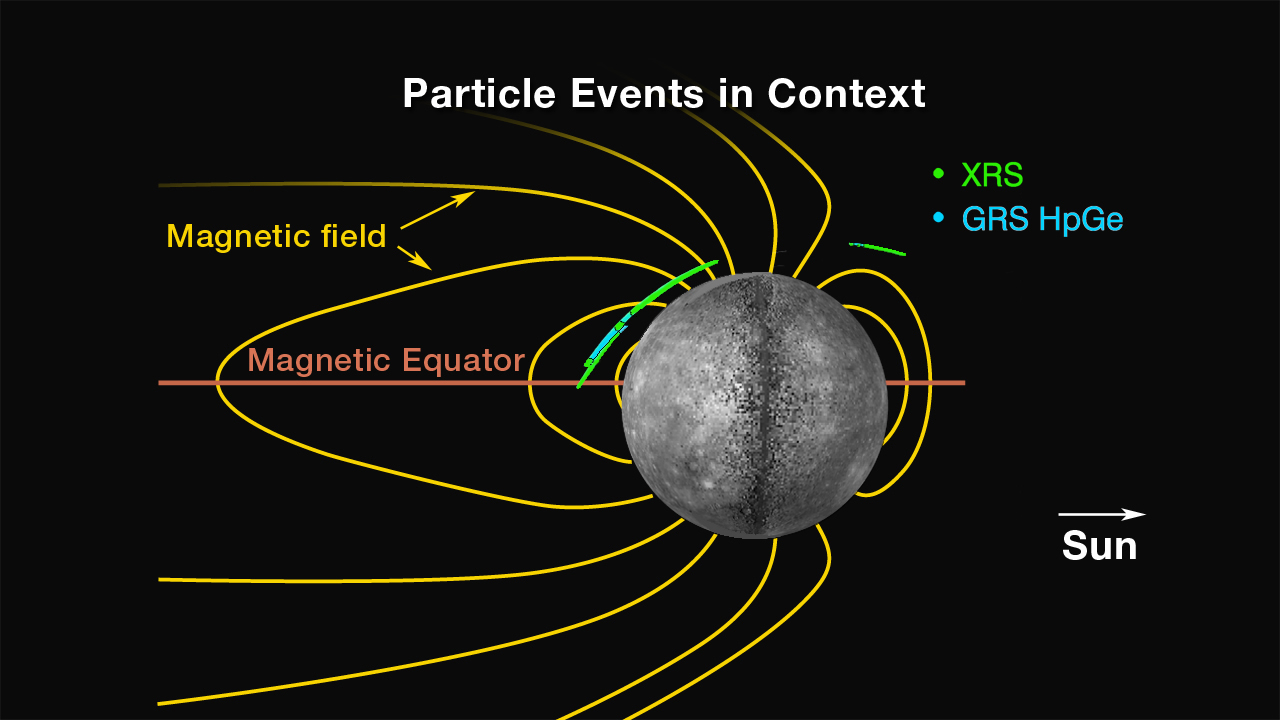
Image 4.4 Locations of energetic electron events relative to Mercury’s magnetic field
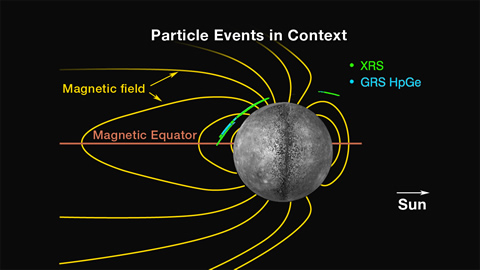
Credit: NASA/The Johns Hopkins University Applied Physics Laboratory/Carnegie Institution of Washington
A cross-section of Mercury’s magnetosphere (in the noon-midnight plane, i.e., the plane containing the planet-Sun line and Mercury’s spin axis) provides context for the energetic electron events observed to date with the MESSENGER XRS and GRS high-purity germanium (HpGe) detectors. The Sun is toward the right; dark yellow lines indicate representative magnetic field lines. Blue and green lines trace the regions along MESSENGER's orbit from April 2 to April 10 during which energetic electrons were detected and MESSENGER's orbit was within ± 5° of the noon-midnight plane. The presence of events on the dayside, their lack in the southern hemisphere, and their frequency of occurrence at middle northern latitudes over all longitudes point to a more complex picture of magnetospheric activity than found at Earth.
Click on image to enlarge.
|
|
Content available at 12:30 p.m. EDT, June 16, 2011.
The NASA MESSENGER News Conference will take place on Thursday, June 16, 2011, at 1 p.m. Reporters may ask questions from participating NASA locations. The briefing also will be streamed live on NASA's Web site at: http://www.nasa.gov.